Download
1 / 1
10 likes | 123 Views
IRIS. Hydrographic Base Layer. Aquatic GAP uses a modified version of the National Hydrography Dataset (NHD). The original dataset is a product of the collaboration between the USGS and the USEPA.

E N D
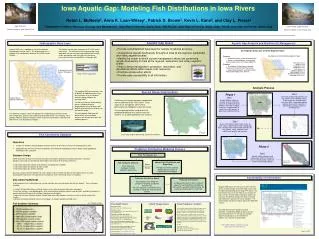
IRIS Hydrographic Base Layer Aquatic GAP uses a modified version of the National Hydrography Dataset (NHD). The original dataset is a product of the collaboration between the USGS and the USEPA. The project area for Iowa encompasses 57 HUC level 8 watersheds. The individual watershed coverages were appended into one coverage and modified with Arc AML scripts provided by staff at the Missouri Resource Assessment Partnership (MoRAP) in Columbia, MO. E. Broadleaf Forest Aquatic Subregion http://nhd.usgs.gov Species Range Determination Preliminary fish ranges based on sample data were established at the HUC 8 level. Draft maps for all 157 species were sent to professional fish biologists in Iowa for review. Final range maps will be used to limit the predicted distribution of a species once the model is run to identify potential river reaches. The modified NHD coverage was sent to MoRAP for additional processing that resulted in a set of standard attributes being added to the coverage table. The Missouri Aquatic Gap modeling process had determined a recommended set of attributes and MoRAP generated these attributes for the Iowa coverage. The Iowa Aquatic Gap team will decide which of the available attributes will actually be used in the modeling process. Central Plains Aquatic Subregion The predictor variables under consideration for modeling inputs include stream flow, temperature, general size category, general downstream size category, soil or geology indicator, gradient category, stream maximum and minimum elevation and downstream size discrepancy category. Draft range map for Brook trout, Salvelinus fontinalis Accessibility of Information Aquatic GAP data users will have on-line, real time access to data through an ArcIMS map service and the ability to download data through FTP. Access via the internet map server will allow users to have the latest version of data without relying on updates to CDs plus the ability to analyze the data using GIS tools without the purchase of costly software. The Iowa Aquatic Gap dataset will be part of the IRIS IMS service. The web interface will include basic GIS functions, including the ability to query, classify, and select features. The site will also include report functionality for user selected fish species, river reaches or watersheds. AGAP Cooperators: IRIS ArcIMS interface showing fish range (http://maps.gis.iastate.edu/iris) August 4, 2004 Iowa Aquatic Gap: Modeling Fish Distributions in Iowa Rivers Robin L. McNeely2,Anna K. Loan-Wilsey1, Patrick D. Brown2, Kevin L. Kane2, and Clay L. Pierce3 1Department of Natural Resource Ecology and Management, Iowa State University, Ames, Iowa; 2GIS Facility, Iowa State University, Ames, Iowa; 3USGS, Iowa State University, Ames, Iowa Upper Iowa River Saukenuk Paddlers Canoe & Kayak Club Chimney Rock, Upper Iowa River Saukenuk Paddlers Canoe & Kayak Club Aquatic Gap Analysis and Biodiversity Management Aquatic Gap Goals • Provide a standardized base layer for sample locational accuracy • Characterize aquatic biodiversity throughout Iowa at the regional, watershed, and valley segment scales • Identify the extent to which current management efforts are conserving aquatic biodiversity in Iowa at the regional, watershed, and valley segment scales • Help to direct management, protection, restoration, and educational efforts within Iowa’s river resources • Prioritize conservation efforts • Provide easy accessibility to all information Developing a Data Layer of Valley Segment Types Purpose • Delineate distinct stream environments • Serve as the backbone for analyzing conservation status of stream segments Protocol • The Nature Conservancy’s Aquatic Community Classification Framework • Based on ecoregions and watersheds aka EcoDrainage Units (EDUs) Example of a Distinct Valley Segment Type * River Size: Medium * Flow: Perennial * Temperature: Warm * Gradient: Moderate * Soil Texture: Fine * Size Discrepancy: Low * Link Category: Moderate * Elevation Category: Medium * Subregion: Central Plains Analysis Process Step 2 Generate predicted distributions for fish species from modeling criteria. These results are analyzed with terrestrial GAP stewardship data to show to what extent a species is protected on publicly owned or managed land. Phase 1 Step 1 Assign attribute values to reaches and run statistical analyses to determine which attributes describe variability. Analyses are performed for each of the 155 species to determine modeling criteria. NHD Step 3 Assess the relative conservation status of each valley segment type using stewardship data. Develop initial conservation priorities for fish species, valley segments, and watersheds (quality and quantity). Draft Fish Community Database • Objectives • Create one database that would give electronic access to all historic riverine fish sampling data in Iowa • Geographically link each community collection to the National Hydrography Dataset (NHD) and to appropriate Hydrologic Units using GIS Phase 2 Predictive Distribution Modeling Process Step 4 Identify valley segments and watersheds (HUC 8,10 and 12) which are biologically significant and of relatively high quality. • Database Design • AGAP staff either directly transferred or manually entered data obtained into a Microsoft Access relational database consisting of separate but related tables that contain three primary elements: • information about the collector and collection, including IBI if available • information about the location of each sample • information about the species collected • By using a unique numeric identifier for each sample, a direct relationship back to the original data is ensured, allowing other information not captured in our database to be retrieved by future investigators. State Fish Species List Turkey River Watershed Species Point Distributions and Range Maps Plot Species Point Locations Assign species to HUC 8 Expert Review of Ranges Fish Community Database Data Collection Database Creation Shapefile Generation Expert Review Predictive Distribution Models Use sampled reach values for predictor variables as input to decision tree. For each species, a statement will be created of values for each predictor variable. • Data Gathering Methods • To be comprehensive in data gathering, several methods were used to locate riverine fish records. These strategies included: • visiting 15 Iowa DNR offices and field stations across Iowa to acquire field notes and reports • literature searches using bibliographies, print and electronic database indexes and abstracts, and library catalogs to acquire published literature, dissertations and government reports • acquiring museum collection records through web-accessible database searches as well as direct contact with curators • directly contacting individual fisheries investigators to acquire unpublished field notes Predicted Distributions ArcMap will be used to select relevant values for each predictor variable per fish and the selected reaches will be the predicted distribution for that fish. Fish Database Summary Fish Sample Locations The AGAP Team: Kevin Kane, Co-PI AIT GIS Facility, ISU, kkane@iastate.edu Clay Pierce, Co-PIDept. Natural Resource Ecology and Management, ISU, cpierce@iastate.edu Patrick Brown, AGAP Web InterfaceAIT GIS Facility, ISU, patrickb@iastate.edu Robin McNeely, AGAP Hydrographic Base Layer AIT GIS Facility, ISU, mobes@iastate.edu Anna Loan-Wilsey, Aquatic Habitat BiologistDept. Natural Resource Ecology and Management, ISU, awilsey@iastate.eduPlease visit the following web pages for more information about Aquatic Gap Analysis: IRIS and Aquatic GAP - maps.gis.iastate.edu/iris Iowa Gap Analysis - www.iowagap.iastate.edu National Gap Analysis - www.gap.uidaho.edu/gap Final Products / Credits:The Iowa Aquatic Gap Analysis Program will publish a final report explaining the biodiversity status of breeding fish species in the state. In conjunction with this biodiversity analysis, an atlas of fish species will also be published. The documents will be available on CD and on the Iowa Aquatic GAP website in Adobe Acrobat .pdf format. The GIS datasets used to create the stewardship and aquatic species layers will be available for downloading via ftp service. This same GIS data will be available for interactive viewing and querying over the Internet using ESRI’s Internet Map Server software. Credits: Iowa State University Iowa Dept. of Natural Resources Missouri Resource Assessment Partnership National Gap Analysis Program • 10,992 sampling sites • 155 fish species sampled • All 99 counties sampled • 1884-2002 sampling date range • 169 individual sources of data • Over 3200 unique stream reaches 100% 8-digit HUCs sampled 92.1% 10-digit HUCs sampled 73.2% 12-digit HUCs sampled