Download
1 / 47
470 likes | 489 Views
Clean Coalition's mission of accelerating the transition to 100% renewable energy and modern grid through community microgrids. The Goleta Load Pocket is a prime location for a comprehensive community microgrid with its vulnerability to transmission outages due to disasters like wildfires. By utilizing solar and energy storage resources, the GLP can achieve complete protection against transmission interruptions. The community microgrid model offers a sustainable and resilient alternative to traditional gas peaker plants, which are both costly and vulnerable to infrastructure failures. Clean Coalition's analysis also highlights the dangers and risks associated with natural gas infrastructure, emphasizing the need for transitioning towards renewable energy solutions like the community microgrid concept. The implementation of community microgrids presents a cost-effective and reliable approach to ensuring energy resilience amidst growing threats to conventional power systems.

E N D
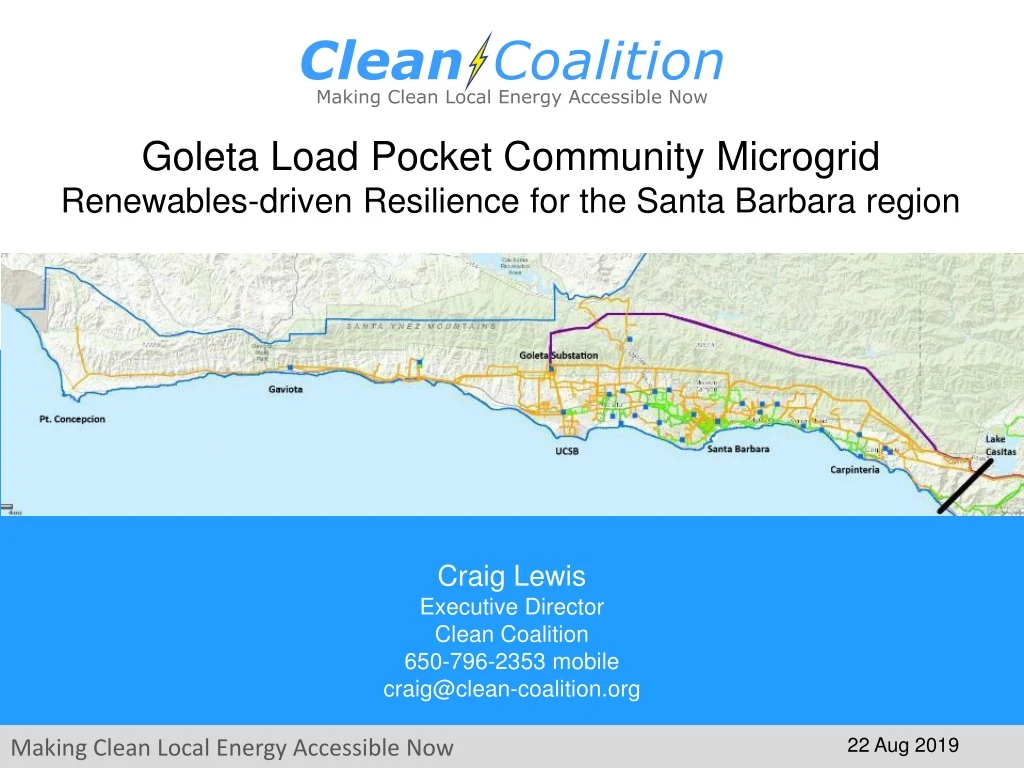
Goleta Load Pocket Community Microgrid Renewables-driven Resilience for the Santa Barbara region Craig Lewis Executive Director Clean Coalition 650-796-2353 mobile craig@clean-coalition.org 22 Aug 2019
Clean Coalition (non-profit) Mission To accelerate the transition to renewable energy and a modern grid through technical, policy, and project development expertise. Renewable Energy End-Game 100% renewable energy; 25% local, interconnected within the distribution grid and ensuring resilience without dependence on the transmission grid; and 75% remote, fully dependent on the transmission grid for serving loads.
Community Microgrids are the grid of the future A Community Microgrid is a new approach for designing and operating the electric grid, stacked with local renewables and staged for resilience. • Key features: • A targeted and coordinated distribution grid area served by one or more substations – ultimately including a transmission-distribution substation that sets the stage for Distribution System Operator (DSO) performance. • High penetrations of local renewables and other distributed energy resources (DER) such as energy storage and demand response. • Staged capability for indefinite renewables-driven backup power for critical community facilities across the grid area – achieved by 25% local renewables mix. • A solution that can be readily extended throughout a utility service territory – and replicated into any utility service territory around the world.
Goleta Load Pocket (GLP) The GLP is the perfect opportunity for a comprehensive Community Microgrid • GLP spans 70 miles of California coastline, from Point Conception to Lake Casitas, encompassing the cities of Goleta, Santa Barbara (including Montecito), and Carpinteria. • GLP is highly transmission-vulnerable and disaster-prone (fire, landslide, earthquake). • 200 megawatts (MW) of solar and 400 megawatt-hours (MWh) of energy storage will provide 100% protection to GLP against a complete transmission outage (“N-2 event”). • 200 MW of solar is equivalent to about 5 times the amount of solar currently deployed in the GLP and represents about 25% of the energy mix. • Multi-GWs of solar siting opportunity exists on commercial-scale built-environments like parking lots, parking structures, and rooftops; and 200 MW represents about 7% of the technical siting potential. • Other resources like energy efficiency, demand response, and offshore wind can significantly reduce solar+storage requirements.
Need for resilience in GLP: May 2016 Edison Fire (NW of Santa Clara station, multiple lines threatened)
Need for resilience in GLP: December 2017, Thomas Fire (multiple outages)
Need for resilience in GLP: Transmission lines subject to preemptive shutoff Source: CPUC FireMap, ESRI, SCE DRPEP Given the recent passage of wildfire legislation and potential liability for wildfires started from utility wires and equipment, SCE has instituted preemptive measures, outlined on the right, that may result in more frequent de-energizing of transmission lines on high fire risk days. The CPUC Fire Map above shows that the Goleta Load Pocket is surrounded by extreme fire threats.
Community Microgrids obviate gas peakers • Thanks in part to Clean Coalition analyses, California regulators blocked repowering of the Ellwood gas peaker in Goleta and constructing the massive Puente gas peaker in Oxnard. • “Let’s take this opportunity to move the Oxnard community into the clean energy future — which is here already.” Carmen Ramirez, Mayor of Oxnard • Significant opportunity to leverage this work to prevent future new gas plant proposals across the country
Community Microgrids cheaper than gas peakers • Leveraging our technical and economic expertise, the Clean Coalition conducted an analysis to determine the viability of solar+storage as a better alternative
Natural gas infrastructure is not resilient • Assertion: Gas-driven generation is often claimed to be resilient. • Reality: Gas infrastructure is not resilient and takes much longer to restore than electricity infrastructure. • Threats: Gas infrastructure can be flat-out dangerous and highly vulnerable to earthquakes, fires, landslides, and terrorism. 2010 San Bruno Pipeline Explosion Source: The City and County of San Francisco Lifelines Study
Recent gas pipeline explosions • October 9, 2018: British Columbia. • September 13, 2018: Merrimack Valley, Massachusetts. Over 80 individual fires, one person killed and 30,000 forced to evacuate. • February 17, 2017: A natural gas pipeline operated by Kinder Morgan in Refugio Texas exploded creating a massive fire. The explosion shook homes 60 miles away. • February 10, 2017: A natural gas pipeline operated by Phillips 66 Pipeline in St. Charles Parish, LA exploded, injuring 3 workers. • February 1, 2017: A DCP pipeline in Panola County TX exploded and created a crater in an airport runway, shutting down the airport for a month. • January 17, 2017: A natural gas pipeline operated by DCP Midstream exploded in Spearman, TX, which led to multiple fire crews being called to the scene. • From 2010 to 2016: Gas companies reported 35 explosions and 32 ignitions at their transmission pipelines, according to federal records. The explosion killed 17 people and injured 86. • September 9, 2010: A pipeline explosion in San Bruno, California, killed eight people and injured 51.
Montecito offers opportunity for initial demonstration: First building block for GLPCM Areas at extreme & high risk for debris flows in the event of major storms. Source: Santa Barbara County OEM
Montecito Upper Village has a concentration of critical community facilities (Fire, Water, Shelter)
Montecito Community Microgrid block diagram Montecito Fire District Montecito Water District Hot Springs Feeder (16kV) Montecito Union School Southern Portion Santa Barbara Substation Coast Village Community Microgrid Diagram Elements Autonomously controllable microgrid relay/switch (open, closed) Tier 2 & 3 Loads
Montecito Community Microgrid – overview • Overall Goal istoprovide renewables-driven energy resilience to critical community facilities in Montecito and to showcase the benefits of Community Microgrids for communities around theworld. • Initial Facilities: • Montecito Fire Protection District headquarters & primary fire station • Montecito Water District headquarters & critical pumps • Montecito Union School • Each site is anticipated to have an independent microgrid with enough solar+storage to be net zero and deliver indefinite renewables-drivenbackup power to the most critical loads: • 10% of the load 100% of the time. • 100% of the load at least 25% of the time. Montecito Fire and Water Districts Montecito Union School
GLP load profile • 201 MW total peak, modeled using 200 MW • Resilience need is for 95 MW peak and 1,385 MWh max day energy • Seasonal load profile from Willdan showing max, min, avg load for single day in each month for Santa Barbara County
Southern California Edison’s planned energy storage Source: SCE LCR RFP April 22, 2019 280 MWh (70 MW x 4-hour) of energy storage has been formally proposed by SCE to the CPUC for siting within the GLP, with online dates by March 2021
How to realize the GLP Community Microgrid • Immediately and ongoing, expand behind-the-meter solar & storage via existing rules and market mechanisms • Net Energy Metering (NEM). • Self Generation Incentive Program • Short-term, fix a misguided prohibition to Wholesale Distributed Generation (WDG) in Santa Barbara County, that currently blocks WDG, even when sited on built-environments like rooftops, parking lots, and parking structures (only a problem in unincorporated areas). • Longer-term, unleash WDG and utilize the existing distribution grid during transmission system outages • Procurement – implement a comprehensive Feed-In Tariff (FIT). • Interconnection – streamline WDG interconnection. • Valuation – ensure full and fair valuation for WDG • Eliminate Transmission Access Charges (TAC) market distortion. • Establish standardized Value of Resilience for Tier 1, 2, and 3 loads (VOR123). • Implement a market mechanism for Dispatchable Energy Capacity Services (DECS) to attract wide deployment of energy storage that is owned by any party and is fully functional at the operational discretion of Load Serving Entities, whose economically optimal needs will change with time.
Wholesale Distributed Generation (WDG) defined Project Size Central Generation Serves Remote Loads 50+ MW Wholesale DG Serves Local Loads 500 kW Retail DG Serves Onsite Loads 5 kW Distribution Grid Transmission Grid Behind the Meter
Need to redefine Utility-Scale Solar in SB County • Existing definition of Utility-Scale Solar Photovoltaic Facilities prohibits WDG even on built-environments like rooftops, parking lots, and parking structures: • Utility-Scale Solar Photovoltaic Facilities. Facilities that are connected to the electrical grid on the utility side of the electric meter and are built for the primary purpose of generating and selling wholesale power. • Proposed new definition of Utility-Scale Solar Photovoltaic Facilities: • Solar facilities of greater than 5 MWac capacity on open land that are connected to the electrical grid on the utility side of any pre-existing electric customer meter for the primary purpose of generating and selling wholesale power. Solar facilities of any size that are constructed on built-environments, including rooftops, parking lots, and parking structures, are not considered to be utility-scale solar facilities. • The amended definition needs to be applied in the following two places: • Santa Barbara County Comprehensive Plan, Land Use Element • Santa Barbara County Land Use and Development Code, Definitions
WDG and FIT drove huge solar use in Germany Solar Markets: Germany vs. California (2002-2012) Cumulative MW Sources: CPUC, CEC, SEIA and German equivalents. Germany deployed over 10 times more solar than California in the decade from 2002 — despite California having 70% better solar resource.
Majority of German solar is small WDG 26% 23.25% 22.5% 19% 9.25% Source: Paul Gipe, March 2012 Germany’s solar deployments are almost entirely sub-2 MW projects on built-environments and interconnected to the distribution grid (not behind-the-meter).
German rooftop solar converts to 3 cents/kWh * For projects not sited on residential structures or sound barriers. • All data in table is from 2016. Foreign exchange conversion applied is 1 Euro to 1.07 US$. • California’s effective rate is reduced 40% due to tax incentives and then an additional 33% due to the superior solar resource. Replicating German scale and efficiencies yields commercial-scale rooftop solar in California at the lowest energy price possible:3 cents/kWh for delivered energy.
Why FITs are the world-class solution FITs are unparalleled in unleashing cost-effective, commercial-scale renewables
Feed-In Tariffs (FITs) and Dispatchability Adders • The Clean Coalition designs market-based, cost-effective FITs with streamlined interconnection • A FIT is a standardized, long-term, guaranteed contract that allows smaller local renewable energy projects to sell power to the local utility or other load-serving entity • FITs work far better than NEM or auctions to unleash commercial-scale renewables. • Our FITs use Market Responsive Pricing, which allows subsequent contract prices to adjust based on market response to pricing of current contracts— ensuring that energy contracts are always set at the best market price to ensure deployments while protecting ratepayers. • A Dispatchability Adder, a fixed ¢/kilowatt-hour (kWh) capacity bonus on top of the FIT rate, to attract energy storage that make renewable energy fully dispatchable.
Direct Relief Microgrid should expand greatly • Location: Santa Barbara, CA. • Owner: Direct Relief (one of the largest disaster recover/supply non-profits in the world). • Brand new 155,000-square-foot pharmaceutical warehouse. • Ships direct to disasters zones, internationally. Cold storage cannot be without power. • Needed a microgrid for indefinite renewables-driven backup power.
Direct Relief Microgrid – onsite Resilience only • Resiliency is #1 concern: • 320 kW PV • 676 kWh Storage • 600 kW generator • 4000 gal. of fuel • PV annual generation designed to cover annual consumption. • Storage designed to time-shift the generation to more valuable times, and provide Resiliency. • Genset provides “back-up to the back-up”. • Direct Relief’s mission is to stay operational in the event of a local disaster that causes interruption of electricity. 676 kWh Li 320 kW PV 600 kW genset; 4000 gal. fuel
Direct Relief Microgrid ready to do way more! Microgrid only serves Direct Relief needs: • 70% of roof and 100% of massive parking area solar potential is unused. • Additional storage not able to be considered due to policy prohibitions around exporting energy from a battery to the grid – even though the energy is 100% stored solar. Ready to do way more:: • 1,133 kW in total solar siting potential, 427 kW more rooftop and 386 kW in parking lots. • Existing switch gear is already sized for the expansion and is just awaiting the policy innovation!
Auctions/solicitations have massive failure rates and are NOT appropriate for commercial-scale Across California RPS solicitations, fewer than 1 in 10 project bids were actually developed, which resulted in high administrative costs for the program and exorbitant risk/cost for renewable energy project development. It is insane to think that auctions could possibly attract commercial-scale renewables and other DER, and yet, California utilities and policymakers chronically prove Einstein's definition of insanity by continuing to pursue local renewables and other DER via auctions!
WDG & NEM interconnection need to be aligned Business Days Our goal is to address the circumstances that lead to differences in timeframe and costs between what are otherwise identical PV systems, based on whether they are installed “behind the meter” (NEM) or “in front of meter” (IFOM or WDG). Currently, there are significant differences in both project development timing and costs between NEM and IFOM/WDG systems:
Comparing Investor-Owned Utilities (IOUs) and SMUD project development timelines • SMUD: about 1 year total (6 months for interconnection) • IOU default cluster process: up to 3.5 years (average of 2 years for interconnection) Interconnection with California IOUs takes 4 times longer than with SMUD
WDG interconnection • Wholesale distributed generation (WDG): projects on the utility side of the meter rather than behind the customer’s meter — often commercial-scale solar • The interconnection process for WDG is broken in California • It can take years to interconnect these projects to the grid • The process can be arduous and expensive • The Clean Coalition has designed a WDG Interconnection Pilot with these aims: • Make the WDG interconnection processes efficient and cost-effective while maintaining a safe and reliable electric grid • Give WDG the same advantageous streamlined treatment as net energy metered (NEM) projects, making it equally fast and predictable. Currently, WDG interconnections are significantly more risky, costly, time-consuming, and expensive.
TAC Campaign • Transmission Access Charges (TAC) in California are assessed inconsistently and unfairly, creating a massive market distortion • In PTO utility service territories, California ratepayers pay the same charge for “using” the transmission system whether or not the energy they use travels across that system • The TAC market distortion has hidden costs: • Californians could pay up to $60 billion extra over the next 20 years • 3 cents per kWh is being stolen from clean local energy projects — 50% of their total cost — making them look more expensive than they really are • Fewer $$ are available for the resilience that Community Microgrids bring our communities • The Clean Coalition is proposing this reform: Charge for electricity transmission based on actual use of the transmission grid • This method is already being used successfully by California’s municipal utilities
Value of Resilience (VOR) • Everyone understands there is significant value to resilience provided by indefinite renewables-driven backup power • But, nobody has yet to quantify this value of unparalleled resilience. • Hence, there is an economic gap for innovative Community Microgrid projects while learning is still is the early stages. • The Clean Coalition aims to establish standardized Value of Resilience(VOR) for critical, priority, and discretionary loads that will help everyone understand that premiums are appropriate for indefinite renewables-driven backup power of critical loads and almost constant backup power to priority loads, which yields a configuration that delivers backup power to all loads a lot of the time • The Clean Coalition’s VOR approach will establish standardized values for resilience of three tiers of loads: • Tier 1 are mission-critical and life-sustaining loads,crucial to keep operational at all times, including during grid outages. Tier 1 loads usually represent about 10% of the total load. • Tier 2 are priority loads that should be maintained as long as long as doing so does not threaten the ability to maintain Tier 1 loads. Tier 2 loads are usually about 15% of the total load. • Tier 3 are discretionary loads make up the remaining loads, usually about 75% of the total load, and are maintained when doing so does not threaten the ability to maintain Tier 1 & 2 loads.
Percentage of time online for Tier 1, 2, and 3 loads for net zero solar+storage microgrids in California Percentage of total load Tier 3 = Discretionary load, ~75% of total load Tier 2 = Priority load, ~15% of total load Tier 1 = Critical, life-sustaining load, ~10% of total load Percentage of time
Dispatchable Energy Capacity Services (DECS) Storage Asset Owner Load Serving Entity (LSE) • Owner retains discretion over any capacity not under DECS contract. • Owner earns guaranteed $/kWh payments for the DECS-contracted energy capacity. • Owner retains discretion over any capacity not under DECS contract. • LSE contracts for dispatchable daily cycling of energy capacity (kWh), at a fixed $/kWh fee, used or not. • LSE optimizes fully flexible energy capacity, dispatching for any purpose, which could be based on time of day, day of week, season, event, and/or other optimizations over the DECS contract period. • Initial DECS contracts are priced at Cost of Service (COS) while subsequent DECS contract pricing is adjusted for market response. DECS contracted energy capacity (kWh) • Owner Reserve • kWh • $ DECS offers a single bankable revenue stream for energy storage owners and a fully flexible & dispatchable energy source for LSEs available daily. Three COS components: • Owner Reserve Net Cost of Energy (NCOE). Capital expenditure ("capex"). Operating expenditure ("opex").
Montecito Community Microgrid block diagram Montecito Fire District Montecito Water District Hot Springs Feeder (16kV) Montecito Union School Southern Portion Santa Barbara Substation Coast Village Community Microgrid Diagram Elements Autonomously controllable microgrid relay/switch (open, closed) Tier 2 & 3 Loads
Valencia Gardens Energy Storage (VGES) project Ecoplexus WDG solar project at the Valencia Gardens Apartments in San Francisco, ~800 kW equivalent to ~80% of annual load.
PG&E Resilience Zones = Community Microgrids Source: PG&E, Jul2019
Get involved in the GLP Community Microgrid • Contribute to the funding requirements of the GLP Community Microgrid Initiative, which should be staffed with several full-time equivalent experts to fulfill the vision. • Bring properties into play for near-term NEM installations and to stage for WDG projects as policies and market mechanisms are innovated. • Bring solutions to the GLP, including Demand Response (DR), Electric Vehicle Charging Infrastructure (EVCI), and Energy Efficiency (EE). • Share the GLP Community Microgrid as a game-changing showcase for delivering renewables-driven resilience to communities. • Subscribe to the Clean Coalition newsletter to stay informed.