Download
1 / 37
370 likes | 495 Views
Photovoltaic modules. n-type substrate. Bias voltage. p-type substrate. I d. V d is the diode voltage I 0 is the reverse saturation current caused by thermally generated carriers At 25 C:. Ideal diode. Real diode. I 0. Photovoltaic modules.

E N D
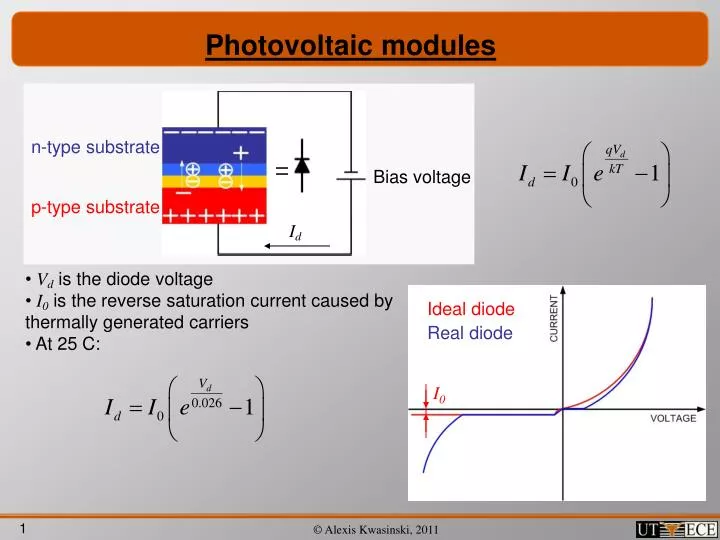
Photovoltaic modules n-type substrate Bias voltage p-type substrate Id • Vd is the diode voltage • I0 is the reverse saturation current caused by thermally generated carriers • At 25 C: Ideal diode Real diode I0
Photovoltaic modules The current source shifts the reversed diode curve upwards ISC VOC Same curve The bias source (voltage source) is replaced by a current source powered by the photons p-n junction is equivalent to a diode ISC Reverse v-i curve for the diode
Photovoltaic modules • From Kirchoff’s current law: • The open circuit voltage is For a more efficient MPP tracking it is desirable that the output current of the PV cells is constant Maximum power point Power Pmax 0.7 • Voc • Isc Current
Photovoltaic modules • Dependence on temperature and insolation:
Photovoltaic modules • More on the dependence on temperature and irradiance (Power / unit of area):
Photovoltaic modules • For a more realistic representation we can consider the following (equivalent to a diode’s model): • 1) Effect current leakage • 2) Effect of internal ohmic resistance ISC Rp + + RS Vd V ISC where Vd = V+IRS This is a transcendental equation - -
Photovoltaic modules • Both effects can be combined to obtain the more realistic (and complex) steady state model: + + RS ISC Rp Vd V - - where Vd = V+IRS This is a transcendental equation
Photovoltaic modules Capacitive effect • As with any diode, there is an associated capacitance. However, this capacitance is relatively small, so the effects on the output can often be neglected. Therefore, PV modules can follow a rapidly changing load very well. • One undesirable effect of the capacitance is that it makes PV cells more susceptible to indirect atmospheric discharges.
Photovoltaic modules • PV cells are combined to form modules (panels). Modules may be combined to form arrays. More modules (or cells) in series More modules (or cells) in parallel • When modules are connected in parallel, the array voltage is that of the module with the lowest voltage. • When several modules are connected in series to achieve a higher array voltage, the array’s current equals that of the module delivering the lowest current.
Photovoltaic modules - • A shadowed module degrades the performance of the entire array (Rp+Rs)(n-1)Imodule + + One module with 50% shadow One module with 100% shadow (n-1)Vmodule Two modules with 100% shadow -
Photovoltaic modules • Bypass diodes can mitigate the effects of shadows but they don’t solve the issue completely. • A better solution will be presented when discussing power electronics interfaces. No shade Shaded without bypass diode Shaded with bypass diode
Photovoltaic modules • Of course, one issue with solar power is its variability, both • Deterministic (day vs. night). • Stochastic (clouds). Measured solar radiation components Predicted solar radiation on PV module Ultracapacitors compensation Batteries or large ultracapacitors arrangement
Lead-acid batteries • Positive electrode: Lead dioxide (PbO2) • Negative electrode: Lead (Pb) • Electrolyte: Solution of sulfuric acid (H2SO4) and water (H2O) H2O PbO2 Pb H2O H2O H2O H2O
Lead-acid batteries • Lead-acid batteries are the most inexpensive type of batteries. • Lead-acid batteries are not suitable for applications with often and deep discharges.
Lead-acid batteries • Lead-acid batteries are very sensitive to temperature effects. It can be expected that battery temperature exceeding 77°F (25°C) will decrease expected life by approximately 50% for each 18°F (10°C) increase in average temperature. [Tyco Electronics IR125 Product Manual]. Internal resistance changes with temperature
Lead-acid batteries • All models imply one issue when connecting batteries of different capacity in parallel: since the internal resistances depend on the capacity, the battery with the lower capacity may act as a load for the battery with the higher capacity. “A New Battery Model for use with Battery Energy Storage Systems and Electric Vehicles Power Systems” H.L. Chan, D. Sutanto “A New Dynamic Model for Lead-Acid Batteries” N. Jantharamin, L. Zhangt
Lead-acid batteries • Battery capacity is often measured in Ah (Amperes-hour) at a given discharge rate (often 8 or 10 hours). • Due to varying internal resistance the capacity is less if the battery is discharged faster (Peukert effect) • Lead-acid batteries capacity ranges from a few Ah to a few thousand Ah. http://polarpowerinc.com/info/operation20/operation25.htm
Lead-acid batteries • The output voltage changes during the discharge due to the change in internal voltage and resistances with the state of charge. Coup de Fouet Patent 6924622 Battery capacity measurement Anbuky and Pascoe Tyco Electronics 12IR125 Product Manual
Lead-acid batteries • Methods: • Constant voltage • Constant current • Constant current / constant voltage • Cell equalization problem: as the number of cells in series increases, the voltage among the cells is more uneven. Some cells will be overcharged and some cells will be undercharged. This issue leads to premature cell failure • As the state of charge increases, the internal resistance tends to decrease. Hence, the current increases leading to further increase of the state of charge accompanied by an increase in temperature. Both effects contribute to further decreasing the internal resistances, which further increases the current and the temperature….. This positive feedback process is called thermal runaway.
Lead-acid batteries • Most calculations are based on some specific rate of discharge and then a linear discharge is assumed. • The linear assumption is usually not true. The nonlinearity is more evident for faster discharge rates. For example, in the battery below it takes about 2 hours to dischage the battery at 44 A but it takes 4 hours to discharge the battery at 26 A. Of course, 26x2 is not 44. • A better solution is to consider the manufacturer discharge curves and only use a linear approximation to interpolate the appropriate discharge curve. • In the example below, the battery can deliver 10 A continuously for about 12 hours. Since during the discharge the voltage is around 12 V, the power is 120 W and the energy is about 14.5 kWh 10 A continuous discharge curve approximation Discharge limit Nominal curve
Wind generators • The output in all types of generators have an ac component. • The frequency of the ac component depends on the angular speed of the wind turbine, which does not necessarily matches the required speed to obtain an output electric frequency equal to that of the grid (unless you tradeoff efficiency) • For this reason, the output of the generator is always rectified. • The rectification stage can also be used to regulate the output voltage. • If ac power at a given frequency is needed, an inverter must be also added. • There are 2 dynamic effects in the model: the generator dynamics and the wind dynamics.
Wind generators • Consider a mass m of air moving at a speed v. The kinetic energy is • Then power is • The last expression assumes an static wind behavior (i.e. v is constant) • The mass flow rate dm/dt is • Thus, • But, power from the wind is different from the generator mechanical power
Wind generators SW Windpower Whisper 200 1 kW Rotor diameter: 2.7 m SW Windpower Whisper 500 3 kW Rotor diameter: 4.5 m
Wind generators • Wind speed probability (then generated power, too) is an stochastic function. • Wind speed probability can be represented using a Rayleigh distribution, which is a special case of a Weibull distribution. • The Rayleigh distribution appears when a 2-dimentional vector has characteristics that: • are normally distributed • are uncorrelated • have equal variance. • A typical probability density distribution • for wind speed is shown next. Rayleigh • distributions approximates these curves.
Microturbines • Microturbines are essentially low-power versions of traditional gas turbines used in large power plants. • Typical power outputs of microturbines range from a few tens of kW to a few hundred of kW. • Natural gas is the most common fuel, but other hydrocarbons, such as kerosene, or bio-fuels can be used, too. Recuperator Exhaust Natural Gas Air Combustion Chamber Generator Compressor Turbine
Microturbines Capstone 30 kW and 60 kW units Ingersoll 70 kW Induction microturbine 250 kW synchronous microturbine Wilson TurboPower 300 kW Mariah Energy 30 kW and 60 kW units
Microturbines and Internal Combustion Engines • Microturbines: • High-frequency output is rectified (and inverted again in ac microgrids). Generator output frequency is in the order of a few kHz (e.g. 1600 Hz for Capstone’s 30 kW microturbine). • Power shaft rotates at high speeds, usually on the order of 50,000 to 120,000 rpm • Very reliable technology (Essentially microturbines are aircraft’s APU’s). Critical parts: bearings and generator. • Generator technologies: Synchronous and permanent magnet • Moderately fast dynamic response • Internal combustion engines • Generator technologies: Synchronous and permanent magnet • Model similar to that of microturbines without the rectifiers. The output can be made to have a fixed frequency
Fuel Cells • Fuel cells convert chemical energy directly into electrical energy. • Difference with batteries: fuel cells require a fuel to flow in order to produce electricity. • Heat is produced from chemical reaction and not from combustion. • Types of fuel cells: • Proton exchange membrane (PEMFC) • Direct Methanol fuel cell (DMFC) • Alkaline fuel cell (AFC) • Phosphoric acid fuel cell (PAFC) (*) • Molten-carbonate fuel cell (MCFC) (*) • Solid-oxide fuel cell (SOFC) (*)
Fuel Cells • Example: PEMFC • The hydrogen atom’s electron and proton are separated at the anode. • Only the protons can go through the membrane (thus, the name proton exchange membrane fuel cell). dc current Heat Oxygen Hydrogen Water Membrane (Nafion) Catalyst (Pt) Anode (-) Catalyst (Pt) Cathode (+)
Fuel Cells • The Tafel equation yields the cell’s output voltage Ec considering additional loosing mechanisms: • The first term is the reversible cell voltage (1.23V in PEMFCs) • The last term represents the ohmic losses, where i is the cell’s current density, and r is the area specific ohmic resistance. • The second term represent the losses associated with the chemical kinetic performance of the anode reaction (activation losses). This term is obtained from the Butler-Volmer equation and its derivation is out of the scope of this course. • In the second term, i0 is the exchange current density for oxygen reaction and b is the Tafel slope:
Fuel Cells • In the last equation R is the universal gas constant (8.314 Jmol-1K-1), F is the Faraday constant, T is the temperature in Kelvins, n is the number of electrons per mole (2 for PEMFC), and β is the transfer coefficient (usually around 0.5). Hence, b is usually between 40 mV and 80 mV. • The Tafel equation assumes that the reversible voltage at the cathode is 0 V, which is only true when using pure hydrogen and no additional limitations, such as poisoning, occur. • The Tafel equation do not include additional loosing mechanisms that are more evident when the current density increases. These additional mechanisms are: • Fuel crossover: fuel passing through the electrolyte without reacting • Mass transport: hydrogen and oxygen molecules have troubles reaching the electrodes. • Tafel equation also assumes that the reaction occurs at a continuous rate. That is, implicit in the analysis is the notion that fuel cells output current should be constant or nearly constant.
Fuel Cells Er = 1.23 V Maximum power operating point Er =1.23V b=60mV, i0=10-6.7Acm-2 r=0.2Ωcm2 Activation loss region Mass transport loss region Ohmic loss region (linear voltage to current relationship) Actual PEMFCs efficiency vary between 35% and 60%
Fuel Cells • This past curve represent the steady state output of a fuel cell. • The steady state output depends on the fuel flow: Amrhein and Krein “Dynamic Simulation for Analysis of Hybrid Electric Vehicle System and Subsystem Interactions, Including Power Electronics”
Fuel Cells • A very good dynamic model of a PEMFC is discussed in: Wang, Nehrir, and Shaw, “Dynamic Models and Model Validation for PEM Fuel Cells Using Electrical Circuits.” IEEE Transactions on Energy Conversion, vol 20, no. 2, June 2005. • Some highlight for this model: • Rohm: represents ohmic losses • Ract: represents the activation losses (related with 2nd term in Tafel equation) • Rconc: losses related with mass transport. • C: capacitance related with the fact that there are opposing charges buildup between the cathode and the membrane. Basic circuit
Fuel Cells • Model for the internal fuel cell voltage E • where, • Comments: • The voltage drop related with fuel and oxidant delay is represented by Ed,cell. • The fuel cell output voltage depends on hydrogen’s and oxygen’s pressure • The fuel cell output voltage also depends on the temperature. • The time constants for these chemical, mechanical, and thermodynamic effects are much larger than electrical time constants. Equal to Er
Fuel Cells • Ed,cell can be calculated from the following dynamic equation: • where τe is the ovreall flow delay. • In steady state, both derivatives are zero, so Ed,cell = 0. But when the load changes, di(t)/dt is not zero, so Ed,cell will be a non-trivial function of time that will affect the fuel cell internal output voltage. • When considering fuel cells dynamic behavior, they all tend to have a slow response caused by the capacitance effect in slide 19, the flow delays, the mechanical characteristics of the pumps, and the thermodynamic characteristics. • Thermodynamic characteristics were introduced in the model through an analogous electric circuit, as shown in the next slide.
Fuel Cells • Simulation model and equivalent electric circuit for the thermodynamic block: • Fuel cells have a slow dynamic response, as shown in the next figure that evaluates the response of a fuel cell to multiple fast step load changes: