Download
1 / 1
10 likes | 116 Views
How do urban drinking water supply reservoirs shift local demographics? Michael Youth ( mdyouth@ncsu.edu ) , George Hess, Melissa McHale, M. Nils Peterson North Carolina State University – Department of Forestry and Environmental Resources . Background. Results .

E N D
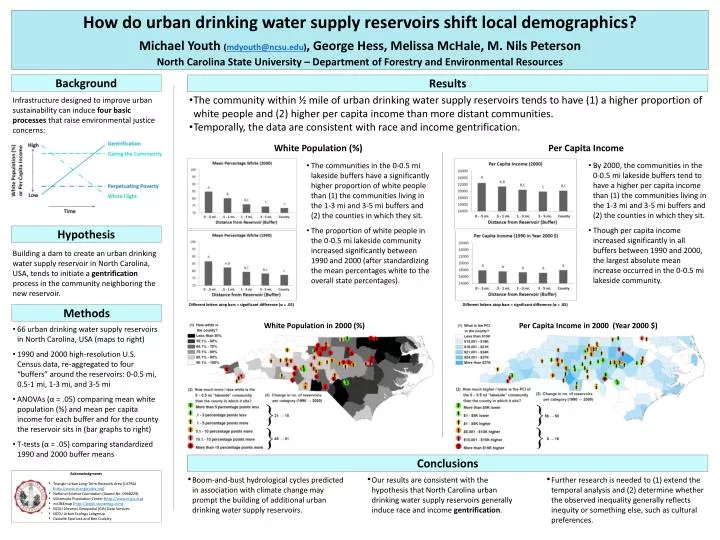
How do urban drinking water supply reservoirs shift local demographics? Michael Youth (mdyouth@ncsu.edu), George Hess, Melissa McHale, M. Nils Peterson North Carolina State University – Department of Forestry and Environmental Resources Background Results • The community within ½ mile of urban drinking water supply reservoirs tends to have (1) a higher proportion of white people and (2) higher per capita income than more distant communities. • Temporally, the data are consistent with race and income gentrification. Infrastructure designed to improve urban sustainability can induce four basic processes that raise environmental justice concerns: White Population (%) Per Capita Income • By 2000, the communities in the 0-0.5 mi lakeside buffers tend to have a higher per capita income than (1) the communities living in the 1-3 mi and 3-5 mi buffers and (2) the counties in which they sit. • Though per capita income increased significantly in all buffers between 1990 and 2000, the largest absolute mean increase occurred in the 0-0.5 mi lakeside community. • The communities in the 0-0.5 mi lakeside buffers have a significantly higher proportion of white people than (1) the communities living in the 1-3 mi and 3-5 mi buffers and (2) the counties in which they sit. • The proportion of white people in the 0-0.5 mi lakeside community increased significantly between 1990 and 2000 (after standardizing the mean percentages white to the overall state percentages). Hypothesis Building a dam to create an urban drinking water supply reservoir in North Carolina, USA, tends to initiate a gentrification process in the community neighboring the new reservoir. Different letters atop bars = significant difference (α = .05) Different letters atop bars = significant difference (α = .05) Methods White Population in 2000 (%) Per Capita Income in 2000 (Year 2000 $) • 66 urban drinking water supply reservoirs in North Carolina, USA (maps to right) • 1990 and 2000 high-resolution U.S. Census data, re-aggregated to four “buffers” around the reservoirs: 0-0.5 mi, 0.5-1 mi, 1-3 mi, and 3-5 mi • ANOVAs (α = .05) comparing mean white population (%) and mean per capita income for each buffer and for the county the reservoir sits in (bar graphs to right) • T-tests (α = .05) comparing standardized 1990 and 2000 buffer means Conclusions • Acknowledgments • Triangle Urban Long-Term Research Area (ULTRA) (http://www.triangleultra.org) • National Science Foundation (Award No. 0948229) • Minnesota Population Center (http://www.nhgis.org) • ncONEmap (http://www.nconemap.com) • NCSU Libraries Geospatial (GIS) Data Services • NCSU Urban Ecology Labgroup • Danielle Spurlock and Ben Coakley • Boom-and-bust hydrological cycles predicted in association with climate change may prompt the building of additional urban drinking water supply reservoirs. • Our results are consistent with the hypothesis that North Carolina urban drinking water supply reservoirs generally induce race and income gentrification. • Further research is needed to (1) extend the temporal analysis and (2) determine whether the observed inequality generally reflects inequity or something else, such as cultural preferences.