Download
1 / 48
480 likes | 687 Views
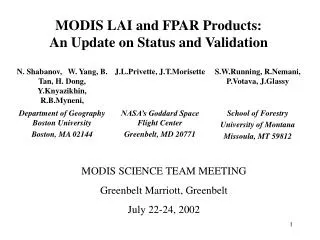
PhD Dissertation Defense. Impact of Uncertainties on Assessment and Validation of MODIS LAI Product. Bin Tan Department of Geography, Boston University. Dissertation Committee Ranga B. Myneni Yuri Knyazikhin Curtis E. Woodcock Feng Gao Jeffrey L. Privete. 1/48. Contents.

E N D
PhD Dissertation Defense Impact of Uncertainties on Assessment and Validation of MODIS LAI Product Bin Tan Department of Geography, Boston University Dissertation Committee Ranga B. Myneni Yuri Knyazikhin Curtis E. Woodcock Feng Gao Jeffrey L. Privete 1/48
Contents 1. Introduction 2. Objectives 3. Research Topics • Assessment of the Broadleaf Crops Leaf Area Index Product from the Terra MODIS Instrument. • Validation of the MODIS LAI product in croplands of Alpilles, France. • Assessment of the impact of geolocation offsets on the local spatial properties of MODIS data: implications for validation, compositing, and band-to-band registration. 4. Concluding Remarks 5. Future Work 2/48
Introduction • From global land cover classifications (1980s) • From AVHRR data – FASIR LAI (1990s) • From MODIS data – MODIS LAI (2000 - present) LAI definition: Green leaf area index, one sided green leaf area per unit ground area. History of global LAI data sets: 3/48
Research Objectives • MODIS LAI product assessment: • Diagnostics of the Collection 3 LAI retrievals over broadleaf crops • Refinement of the MODIS LAI algorithm • Analysis of the Collection 4 product • Validation: • Generation of a reliable reference LAI map from field data • Validation of the Collection 4 MODIS LAI product over croplands • Impact of geolocation offsets: • Quantification of the effect of geolocation offsets on MODIS data quality • Evaluation of the impact on validation, compositing and aggregation 4/48
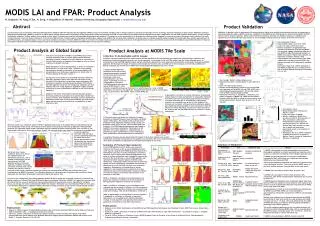
Research Topics Part One Assessment of the Broadleaf Crops Leaf Area Index Product from the Terra MODIS Instrument Tan, B., Huang, D., Hu, J., Yang, W., Zhang, P., Shabanov, V. N., Knyazikhin, Y., and Myneni, R. B. (2005). Analysis of Collection 3 and 4 MODIS broadleaf crops LAI products: a case study of the Bondville site.IEEE Trans. Geosci. Remote Sens., (submitted for publication). 5/48
Data • The MODIS LAI product • Global, all land tiles over broadleaf crops • Year 2001 • MODIS Terra Collection 3 and Collection 4 • The MODIS surface reflectance product • Tile h11v04, Fluxnet Bondville site (Illinois, USA) • July 20th to 27th, 2001 • MODIS Terra Collection 3 • Field LAI • Bondville site • Bigfoot: 2.5 LAI (July 2000) and 3.6 LAI (August 2000) 6/48
Three anomalies Three anomalies in Collection 3 LAI product: • Unrealistically high LAI values during the peak growing season from both the main and back-up algorithms • Differences in LAI seasonality between the main and back-up algorithms • The main algorithm tends to fail more often during summer peak growing season 7/48
Three anomalies at tile scale The anomalies in tile h11v04 are similar to the ones at the global/continental scale. 8/48
Uncertainties in surface reflectances Coefficient of variation: = standard deviation / mean The uncertainties of poor quality data are higher than those of good quality data 9/48
Relationship between input & output quality Retrieval index: The percentage of pixels for which the main algorithm produces a retrieval. • Retrieval index decreases with increasing uncertainties of surface reflectances • LAI uncertainties increase with increasing uncertainties of surface reflectances • The upper limit of MODIS LAI product precision is about 80% for broadleaf crops 10/48
Main algorithm retrievals backup algorithm retrievals 50% contour of good quality data Mismatch between observed and simulated surface reflectances • Data are from the broadleaf crops pixels in tile h11v04, days 201 - 208 in year 2001 • In Collection 3, only 10% of the highest data density was covered by the retrieval domain of the main algorithm • In Collection 4, coverage of the main algorithm was increased to 30% 11/48
Collection 4 performance (tile scale) • Unrealistically high LAI values during the peak growing season from both the main and back-up algorithms (resolved) • Differences in LAI seasonality between the main and back-up algorithms • The main algorithm tends to fail more often during summer peak growing season (resolved) 12/48
Collection 4 performance The two Collection 3 LAI anomalies were mostly resolved in Collection 4. 13/48
Conclusions • Three anomalies are seen in the Collection 3 LAI product of broadleaf crops. • The quality of LAI retrievals depends on the quality of surface reflectance data input to the LAI algorithm. • The algorithm frequently fails or generates LAI over-estimates because of a mismatch between modeled and measured reflectances. • The Collection 3 LAI retrieval anomalies over broadleaf crops were mostly resolved in Collection 4. • The few retrievals in the Collection 4 product from the back-up algorithm should be used with caution, and they are not suitable for validation studies. 14/48
Research Topics Part Two Validation of MODIS LAI product in croplands of Alpilles, France Tan, B., Hu, J., Zhang, P., Huang, D., Shabanov, N. V., Weiss, M., Knyazikhin, Y., and Myneni, R. B. (2005). Validation of MODIS LAI product in croplands of Alpilles, France.J. Geophys. Res., vol. 110, D01107, doi:10.1029/2004JD004860. 15/48
Data • In situ data, including LAI and GPS measurements • ETM+ data from March 15th, 2001 • Collection 4 MODIS LAI product • MODIS Land Cover Product • Collection 4 MODIS Surface Reflectance product 16/48
Feed back to algorithm refinement Comparison with MODIS LAI product Field measurements Fine resolution LAI map Aggregated LAI map High resolution satellite data Validation procedure • MODIS LAI values cannot be directly compared to field measured LAI values • A fine resolution LAI map is required to bridge field and MODIS LAI values • How sensitive is the relationship between LAI and surface reflectances to the errors in estimation of both variables? 17/48
Accuracy, precision, uncertainty Consider a true value T, and its estimates Xi, i = 1, 2 …N. The average of Xi isμ. Accuracy (bias) : Precision (standard deviation) : Consider a number of true values Tk, and their estimates Yk, k=1,2,…,M. Uncertainty (root mean square error) : 18/48
well posed problem well posed problem 1% precision 1% precision 1% precision 1% precision well posed problem ill posed problem Well posed vs. ill posed problem B A ? 19/48
Forward mode(LAI -> surface reflectance) LAI1,ETM1 LAI1,ETM1 LAI1,ETM1 LAI2,ETM2 LAI2,ETM2 Is LAI2 close to LAI1? YES LAI3,ETM3 NO Is LAI3 close to LAI1? LAI4,ETM4 LAI4,ETM4 Is LAI4 close to LAI1? YES … … … … Variation in LAI values results in comparable variation in corresponding surface reflectance. Well posed problem ensures stable retrievals 20/48
Inverse mode(surface reflectance -> LAI) LAI1,ETM1 LAI1,ETM1 LAI1,ETM1 LAI2,ETM2 Is ETM2 close to ETM1? NO LAI3,ETM3 LAI3,ETM3 YES Is ETM3 close to ETM1? LAI4,ETM4 LAI4,ETM4 Is ETM4 close to ETM1? YES … … … … Variations in surface reflectances result in magnified variations in retrieved LAI values. Ill posed problem may cause unstable retrievals 21/48
Stable relationship • Form 49 data sets by joining respective groups, generated in forward and inverse modes • The relationship between mean simple ratio and mean LAI is LAI=0.22*SR-0.33 • LAI values obtained by applying this equation to mean simple ratio are treated as a set of reference satellite-derived LAIs 22/48
Comparison of retrieval techniques Simple Ratio MODIS Algorithm Neural Networks The fine resolution MODIS LAI algorithm performs best. 23/48
Comparison of simple ratio and MODIS fine resolution maps • LAI values predicted by the empirical relationship exhibit high variations due to observation errors. • MODIS algorithm retrievals are stable with respect to the observation precision. 24/48
0.2 0.4 0.6 0.8 1.0 1.2 1.4 1.6 Non-biome1 Comparison with MODIS LAI Product The accuracy, precision, and uncertainty in the Collection 4 MODIS LAI (reprocessed LAI) are 0.2 (0.0), 0.36 (0.25), and 0.48 (0.48). 25/48
Conclusions • Retrieval of LAI from satellite data is an ill posed problem. • Uncertainties in field LAI and high resolution satellite data cannot be ignored in generating the reference fine resolution LAI map. • Comparison of reference and corresponding MODIS retrievals suggests satisfactory performance of the Collection 4 MODIS LAI algorithm. 26/48
Research Topics Part Three The impact of geolocation offsets on the local spatial properties of MODIS data: implications for validation, compositing, and band-to-band registration Tan, B., Woodcock, C. E., Hu, J., Zhang, P., Ozdogan, M., Huang, D., Yang W., Knyazikhin, Y., and Myneni, R. B. (2005). The impact of geolocation offsets on the local spatial properties of MODIS data: Implications for validation, composition, and band-to-band registration.Remote Sens. Environ., (to be submitted). 27/48
Geolocation offsets • Geolocation offsets include: • Pixel shift: mismatch between MODIS observations and predefined grid for storing the observations • Geolocation errors: errors in assigning geolocation coordinates to observations. The magnitude is 50 m at 1 sigma • Advantages of a simulation approach for studying geolocation offsets: • Impact of view zenith angle can be quantitatively evaluated • The baseline data (ETM+) is a precise reference for evaluating MODIS data quality 28/48
Data • ETM+ data • MODIS data: • 8-day composite of MODIS surface reflectance product. • 500-m resolution • 08/12-09/12, 2001 • Tile h12v04, near Harvard Forest • MODIS observation pointer product. • 500-m resolution • 07/01, 2004 • Tile h18v04, near Alpilles, France 29/48
MODIS characteristics • Triangular Modulation Transfer Function (MTF) • 25% of the pixel’s signal comes from adjacent nominal observation areas • The area closer to the observation center contributes more to the observation • Wide field of view • Observation size is increasing with increasing view zenith angle • adjacent scan lines overlap when the view zenith angle > 24 degrees 30/48
Simulations • MODIS measurements constitute “observations layer” that has to be matched to a predetermined grid of bins • Offsets between the observations and bins of MODIS image depend on geometry of satellite measurements ( “pixel shift”) • On top of the “pixel shift” there is also a geolocation error (50 m at 1 sigma) • For large view zenith angles, one observation will be allocated to as many as six bins View zenith angle increasing Orbit 31/48
Simulations (cont.) • Gridding Process • Simple method • Complex method • Compositing Process • Maximum NDVI • Minimum blue • Minimum VZA (view zenith angle) • Aggregation Process • Simple method • Complex method 32/48
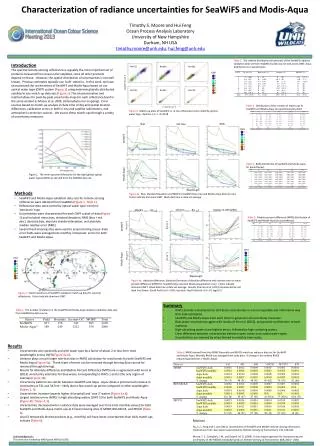
View zenith angle effect 0 55 Data quality decreases as view zenith angle increases because the observation size is significantly greater than the bin size at the end of the swath. 33/48
Observation-to-bin registration Simulated MODIS data MODIS data Contribution Index: proportion of an observation derived from the bin area in which it is stored. It is equivalent to observation coveragein Collection 4 MODIS products. • Often only a small part of an observation is derived from the area of the bin where it is stored • The fact that the contribution indices are similar in simulated and MODIS data supports validity of the foregoing analysis 34/48
Reference data VS. simulated MODIS data Reference data is produced without view geometry and triangular MTF effects. The spatial resolution is same as simulated MODIS data, but without geolocation offsets. 35/48
Impact of view zenith angle and spatial resolution on Contribution Index • CI decreases with increasing view zenith angle due to increasing observation area • CI increases with decreasing spatial resolution • At the scale 4 times coarser then the native resolution, most of the CIs > 75%. Such scale or coarser should be used to achieve reliable results in the MODIS land products analysis and especially validation 36/48
8-day composite data Maximum NDVI Minimum blue Minimum VZA • The coverage of vegetated areas (the red areas in the images above) is augmented by the minimum blue and maximum NDVI methods. • The coverage of water bodies (dark areas in the images above) is reduced by the maximum NDVI method. In minimum blue method, the water areas shrink, if the water is surrounded by dense-vegetation, which is even darker than water in blue band. Otherwise, the water area expands. • The minimum VZA compositing demonstrates best performance, and preserves most of the ground information. 37/48
Bias in the 8-day composite data HF: Harvard Forest KP: Konza Prairie LTER LT: Lake Tahoe • Maximum NDVI and minimum blue methods overestimate NDVI • The magnitude of the bias changes with time and space • NDVI from minimum VZA method is close to reference NDVI 38/48
Spatial information conveyed by the simulated 8-day composite data NDVI from minimum VZA method has the highest spatial variation. 39/48
Spatial information conveyed by the 8-day composite MODIS data Temporal variations in semivariograms are due to variations in availability of data with minimum view zenith angle, which are caused by clouds and other unpredictable factors. 40/48
Reference data VS. simulated 8-day composite MODIS data • Correlation between NDVI from maximum NDVI/minimum blue methods and reference is poor • Maximum NDVI and minimum blue methods overestimate NDVI • Minimum view zenith angle method performs best 41/48
Band-to-band registration of MODIS observations Weighting space • Weighting space for 1000 m observation is not equal to the sum of weighting spaces for two 500 m observations • Instead, sum of weighting spaces for three adjacent observations should be used • A rectangular MTF is used in the along-track direction 1000 m observation 500 m 42/48
Definition of matching index Matching index is used to quantitatively evaluate the overlap between two weighting spaces: 0 - no overlapping between two spaces 1 - two spaces are exactly same 43/48
Matching index • MODIS products at coarse resolution are not comparable to the aggregated fine resolution MODIS products • Band-to-band registration can be improved at 1km (MODAGAGG) through aggregation of MODIS observations before binning (MOD09GHK) 44/48
Conclusions • The gridding process leads to a significant pixel shift effect • The relationship between the location of storage bins and corresponding observations is weak due to the geolocation offsets • Comparison of reference and MODIS data at the pixel scale is unadvisable. The comparison should be at a spatial resolution as coarse as 4 times of the native resolution • Multi-date compositing based on spectral information results in significant biases in derived biophysical parameters • Poor band-to-band registration of native 250 m bands (red and NIR) and native 500 m bands (other five bands) restricts the use of all seven optical MODIS bands in the MODIS LAI algorithm • Band-to-band registration can be improved through aggregation of MODIS observations if applied before gridding 45/48
4. Concluding remarks • LAI retrievals over broadleaf crops were analyzed. The mismatch between modeled and satellite measured surface reflectances was found to be responsible for the anomalies in Collection 3 LAI product over broadleaf crops. The anomalies were mostly resolved in Collection 4 product with the revised LUTs. • LAI retrievals over grasses and cereal crops were analyzed. The retrieval of LAI from satellite data is an ill-posed problem. The use of information on input errors in the LAI algorithm is required to generate solutions to the ill-posed problem. Validation of the Collection 4 MODIS LAI product over grasses and cereal crops suggest satisfactory algorithm performance. • MODIS geolocation offsets were analyzed. MODIS band-to-band registration of bands with different native resolutions is poor. MODIS data should be validated at a scale as coarse as at least 4 times of the native resolution. 46/48
5. Future work • This study evaluated MODIS LAI retrievals over only two sites. The techniques developed here should be applied to assess the performance of the algorithm over a range of vegetation types. • Geolocation accuracy was assessed in this study for MODIS Terra sensor only. The development of combined Terra and Aqua MODIS land products requires further assessment of geolocation agreement between MODIS Terra and Aqua sensors. 47/48
Thank you ! Questions ? 48/48