Download
1 / 20
200 likes | 434 Views
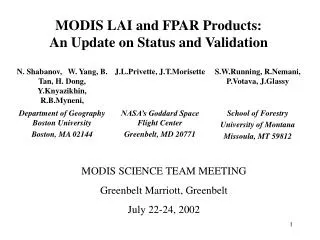
MODIS LAI and FPAR Products: An Update on Status and Validation. MODIS SCIENCE TEAM MEETING Greenbelt Marriott, Greenbelt July 22-24, 2002. MODIS LAI/FPAR HIGHLIGHTS. Start date: September-27-1996 End date: June-14-2003 5 years 10 months 20+ Journal articles Graduated: 4 PhDs; 6 MAs

E N D
MODIS LAI and FPAR Products: An Update on Status and Validation MODIS SCIENCE TEAM MEETING Greenbelt Marriott, Greenbelt July 22-24, 2002
MODIS LAI/FPAR HIGHLIGHTS • Start date: September-27-1996 • End date: June-14-2003 • 5 years 10 months • 20+ Journal articles • Graduated: 4 PhDs; 6 MAs • Current: 4 PhDs; 1 MA • Developed the MODIS LAI/FPAR algorithm • Produced 2 yr record of MODIS monthly LAI and FPAR data sets • Produced 20+ yr record of PAL and GIMMS AVHRR LAI and • FPAR data sets
Boston University LAI/FPAR Product(MOD15_BU 1km and MOD15_BU 4km) Format Monthly best quality compositing of MOD15A2 product for collection 2 and 3, 1 and 4 km resolutions, binary (separate files for LAI, FPAR, QC and geolocation), MODLAND Integerized Sinusoidal projection Temporal Coverage June 2000 to May 2002 (2 years, 24 months) Distribution Boston University: ftp://crsa.bu.edu/pub/rmyneni/myneniproducts/ CDROMS
Data Encoding and QA To convert from DN values to physical values, use the following scaling LAI= 0.1DN_LAI; FPAR=0.01DN_FPAR Quality Quality 1 5 4 8 100 1 MOD15_BU 1km QA MOD15_BU 4 km QA
MOD_15 BU 4km, 2001 April March May June July August September October November
Global MODIS LAI/FPAR 4 km, monthlyCDROM /datacontains compressed (.gz) binary data files of the product. Two versions of MOD15A2 data were used to create data set on this CD: (i) Collection 2 (from June to October, 2000); (ii) Collection 3 (from November, 2000 to May, 2002). Within each month, three types of data are generated: FPAR, LAI and QA (quality flag). The dimension of each 4 km resolution data file is 10800x5400. /imagescontains JPEG images to visualize binary data files of /data directory /utilities contains (a) reference latitude and longitude binary files (files lat_4km.bin and long_4km.bin; scale factor is 100); (b) ENVI color tables (density slicing). These are files with extension .dsr; (c) Sample header files (for data in /data directory, for lat_4km.bin and long_4km.bin files). /toolscontains helper programs to process binary files /publicationscontains .pdf file of key publications about MODIS LAI/FPAR algorithm and product /posterscontains 3 posters illustrating MODIS LAI/FPAR algorithm and product readme.txt
LAI and FPAR Validation Sites Assessing the uncertainties of satellite derived LAI and FPAR with respect to in situ measurements
BiomeContinentLatitudinal transect LAI AND FPAR (MOD 15A2): VALIDATION
Flakaliden Field Campaign, Sweden, June 22 – July 07, 2002(640 07’N, 190 27’E)
Flakaliden Field Campaign Participants Sweden – 19 Finland – 7 USA – 5 Italy – 4 Germany – 2 Estonia – 2 Iceland – 1 Instruments Fish eye system LAI-2000 – 12 LI-1800 – 2 LI-1800 with External Integrating Sphere – 1 GPS – 5; PAR ceptometer PAR and SWR sensors Measurements LAI, FPAR Canopy spectral reflectance Canopy spectral transmittance Soil/understory spectra Leaf optical properties PAR and SWR above canopy Shoot structure
Pandamatenga S18 39.5 E 25 29.8 Maun S 19 55.8 E 23 30.7 Okwa S 22 24.6 E 21 42.8 Tshane S 24 10.1 E 21 53.3 SAFARI 2000 WET SEASON FIELD CAMPAIGN MARCH 3-18, 2000
1 4 2 3 5 6 7 8 9 10 12 11 14 13 15 Validation of Moderate Resolution Satellite LAI and FPAR: Patch by Patch Comparison Color RGB image from ETM+ of a 1 km by 1 km region of the Moun site Map of the same region using a segmentation procedure which groups pixels into patches based on their spectral similarity and adjacency. Mean LAI derived from field over patches derived from field measurements and ETM data. SAFARI 2000 WET SEASON FIELD CAMPAIGN MARCH 3-18, 2000 Tian, Y., C. E. Woodcock, Y. Wang, J. L. Privette, N. V. Shabanov, L. Zhou, W. Buermann, J. Dong, B. Veikkanen, T. Hame, M. Ozdogan, Y. Knyazikhin, and R. B. Myneni, Multiscale Analysis and Validation of MODIS LAI Product over Maun, Botswana. I. Uncertainty Assessment , Remote Sens. Environ., 2002 (in print). Tian, Y., C. E. Woodcock, Y. Wang, J. L. Privette, N. V. Shabanov, L. Zhou, W. Buermann, J. Dong, B. Veikkanen, T. Hame, M. Ozdogan, Y. Knyazikhin, and R. B. Myneni, Multiscale Analysis and Validation of MODIS LAI Product over Maun, Botswana. II. Sampling Strategy , Remote Sens. Environ., 2002 (in print).
The first-year MODIS LAI algorithm correctly accommodates structural and phenological variability in semi-arid woodlands and savannas, and is accurate to within the uncertainty of the validation approach used here. Privette, J.L., Myneni, R.B., Knyazikhin, Y., Mukufute, M., Roberts, G., Tian, Y., Wang, Y., and Leblanc, S.G., Early Spatial and Temporal Validation of MODIS LAI Product in Africa, Remote Sems.Environ., 2002 (in print).
Field Campaign in Ruokolahti, Finland, June 14 – June 21, 2000
Image Segmentation Color RGB image from ETM+ of a 1 km by 1 km region of the field site Segmentation result
Patch Level Correlation between Field-measured LAI and Reduced Simple Ratio (RSR) Patch scale
0 1 2 Field Campaign in Ruokolahti, Finland, June 14 – June 21, 2000 A 30 m resolution LAI map of a 10x10 region derived from ETM+ image Aggregate the 30 m ETM+ LAI map to 1 km LAI map Compare statistical properties of the MODIS and aggregated LAI fields
Field Campaign at Harvard Forest: Saturation FPAR and LAI histograms for a 5x5 km area (25 pixels) derived from the BigFoot data (shaded contour) and MODIS retrieval (black line). Values produced by the main algorithm were used. To maximize number of unsaturated pixels the composite for days 241-248 (August 28-September 4, 2000) was selected, where 5 of the 25 pixels were unsaturated. Histograms of LAI and FPAR values derived from ETM+ data are shown as a red line. Shabanov, N.V., Y. Wang, W. Buerman, J. Dong, S. Hoffman, G.R. Smith, Y. Tian, Y. Knyazikhin, and R.B. Myneni, Validation of the radiative transfer principles of the MODIS LAI/FPAR algorithm with field data from the Harvard Forest, Remote Sens. Environ., 2001 (submitted for publication).
Flux tower sites A number of ecological variables (leaf area index, biomass and NPP) besides carbon/water and energy fluxes are measured at these sites. MODIS data are being extracted regularly over these sites. 2001 MODIS data extracted over these sites were used to verify the magnitudes and seasonality of a number of MODIS products. Credit: ORNL DAAC
Willow Creek, Wisconsin Credit: ORNL DAAC