Download
1 / 28
1.05k likes | 2.01k Views
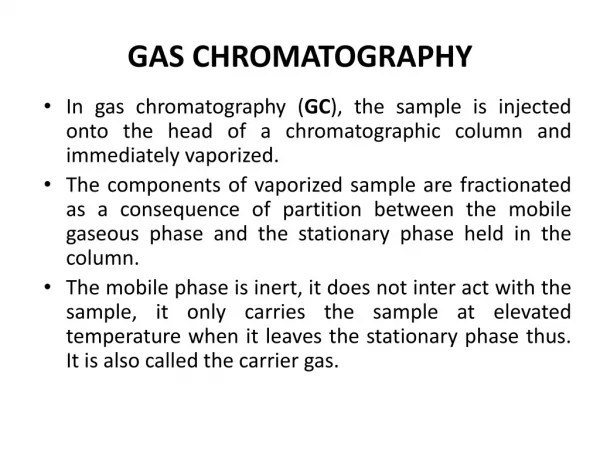
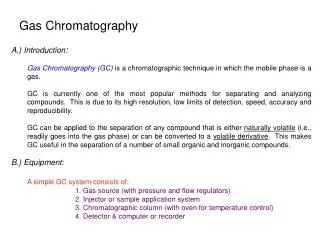
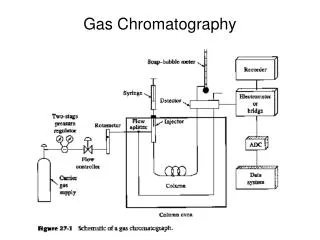
GAS CHROMATOGRAPHY. CHAPTER 21. Gas Chromatography Produces Chromatograms. GC is used to identify, (compare to standards) separate, and quantify (use peak area) samples. Stable, but Volatile Analytes.

E N D
GAS CHROMATOGRAPHY CHAPTER 21
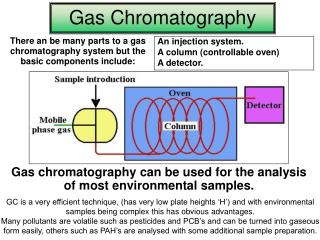
Gas Chromatography Produces Chromatograms GC is used to identify, (compare to standards) separate, and quantify (use peak area) samples.
Stable, but Volatile Analytes • Volatility is related to vapor pressure and boiling point. Larger molecules (> 600g/mol) are not volatile enough for GC. • Boiling points < 500oC help, as does low polarity. • Heated injection and separation may degrade some compounds. • Thermal stability is required. • The structure of the analyte could be changed, in a known way, to increase volatility—Derivatization.
Factors That Determine Retention in GC • Retention is related to the relative time the analyte is in the mobile phase compared to the stationary phase. • Retention is affected by volatility,column temperature, and the degree of interaction with the stationary phase. • More volatile analyte elutes first (volatility increases make retention decrease). Note the homolog alkane series.
Factors That Determine Retention in GC • TEMPERTURE: Decreasing column temperature (via oven) leads to longer retention times due to a drop in volatility. • Note this effect in the chromatograms where temperature is changed on the same system:
Factors That Determine Retention in GC • Kovats Retention Index (I): retention of an analyte on one column is compared to the retention seen at the same temperature and column for a series of alkanes. • t’Rz (adjusted retention time for n-alkane that elutes just prior to analyte) • t’R(z+1) (adjusted retention time for n-alkane that elutes just after the analyte) • z refers to the number of carbon atoms in the homolog series. • Exercise 21.3 allows practice for Kovats index.
Factors That Determine Retention in GC • Interactions with the stationary phase can affect retention time….Examine the polarity of analytes and the stationary phase for interactions. Which of these two is more polar? Which would tend to retain polar analytes?
Use Kovat’s to Compare Differences in Retention Time Related to Polarity
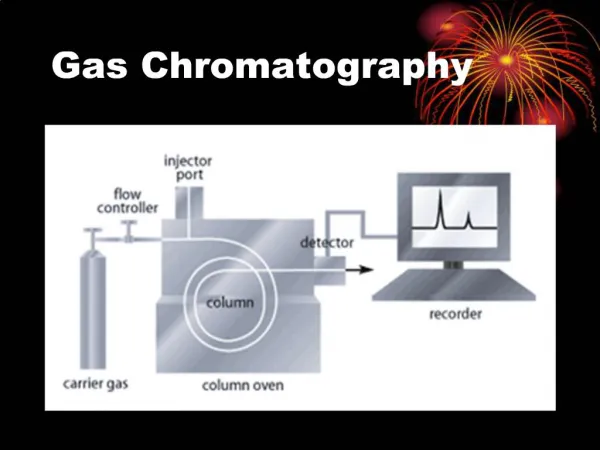
Mobile Phases and Elution Methods • In the mobile phase, gas is low density and moves quickly through the column, giving rise to narrow peaks and quick separations. Low viscosity permits the use of longer columns (without undue pressure build up). • Move solutes through with no or minimal interaction with analytes. (He, N2, and Ar common) • The carrier gas (mobile phase) must be high purity to avoid contaminating the sample and possibly breaking down column materials.
Mobile Phases and Elution Methods • For simple samples a constant temperature may be maintained during the analysis (isothermal method). • Complex samples often contain analytes with a wide range of volatility, causing a wide range of retention times. • The figure shows, using the isothermal method, that some analytes emerge quickly, others much longer. Also, resolution varies.
Mobile Phases and Elution Methods • Temperature programming offers a solution to the “general elution problem” (separating with reasonable resolution in reasonable time). • Start chromatography at a lower temperature, then gradually ramp up during analysis—note the four regions.
GC Supports and Stationary Phases • Columns may be discussed/compared by noting if they are packed or open-tubular. • Packed columns are filled with small, absorbent particles or coated particles. Use a glass or metal column ~ 1–2 meters in length and a few mm wide. • Silica (SiO2) is used to make diatomaceous earth, which can be coated for use in Gas-Liquid chromatography. • Molecular sieves or porous polymers are used with gas-solid chromatography. • Packed columns have typical applications in simplier systems. A large surface area allows larger sample injection but has lower efficiencies.
GC Supports and Stationary Phases • An open-tubular column (capillary column) has a stationary phase coated on its interior. These are much longer than packed columns (10–100m) with small diameters (0.1–0.75 mm). They also tend to be faster, have better resolution, and better efficiency. WCOT SCOT PLOT
GC Supports and Stationary Phases • Compare packed and open-tubular columns:
Take a Closer Look • Diatomaceous earth produces high surface area packing material. • Molecular sieve have (zeolite) well defined pore size/structure.
Gas-Liquid Chromatography • Gas-solid chromatography utilizes solid, absorbent material, and molecular sieves with good applications to small hydrocarbons and gases. The surface area, the size of pores, and functional groups on the support’s surface determine separation. GSC is not as common as GLC, but can be packed or open. • Gas-Liquid Chromatography utilizes high viscosity and low volatility. It’s easy to place the liquid spread over the support. • The liquid coating is often based on polysiloxane with varying molar masses ( 1000–106 g/mol).
Bonded Phase Support • Some “column bleed” occurs during heating when the liquid stationary phase breaks down or vaporizes. This affects retention and even detectors. • If the liquid can be covalently bonded to the solid support, a “bonded phase support” is formed, which is more stable (allows higher temp to be used.) • This is formed by reacting a polysiloxane liquid phase with a silanol group on a solid silica support. • A cross-linked stationary phase can also be used.
Detectors: Thermal Conductivity • TCD can be used for organic and inorganic analytes. • The key aspect is the ability of the carrier gas and the analytes to change the conductivity of a wire filament, which will vary with different analytes. • The carrier gas should have different thermal conductivity of analytes. • TCD is a non-destructive type of detection that uses a Wheatstone bridge style. Downsides are the response to impurities, leakage in air, and poor response to LOD.
Wheatstone Bridge TCD Most common carrier
Detectors: Flame Ionization • FID uses fuel mixed with carrier and organic analyte. Analyte forms ions in the flame. • Cations from the flame are gathered by the negative electrode—produces a current. • Advantage:inorganics do not respond (He carrier gas), so the low background signal allows for LOD 100- to 1000-fold lower then TCD. • Disadvantage: destructive
Detectors: Selective Detectors • Specific for specific types of chemicals (i.e., nitrogen-phosphorus detector, NPD) • Measures ions produced from eluting N or P compounds, but generates e– from a heated surface (not flame) that combine with electronegative elements to form negative ions • Good selectivity, good LOD, but must periodically change heated material
Detectors: Electron Capture • Detects electronegative atoms or groups (Cl, -NO2) and also polynuclear aromatics and conjugated carbonyl compounds • These groups capture e– that are produced from nuclear radiation from 3H • Carrier gas hit by these e– can release secondary e–, which will be absorbed by analyte • Has good LOD, but a narrow linear range and requires radioactive source
Detectors: Mass Spectrometry • Detects and measures by converting eluting analytes into gas phase ions (forming a molecular ion or fragmenting analyte [and ionizing]. Compare patterns of ions and fragments to known values. Intensity relates to amounts. • A portion of analytes is converted to anions via electron impact or chemical impact (softer, less fragments). • Gas phase ions are separated by mass/charge ratio using a quadrupole mass analyzer. (Uses four parallel rods with well-defined potentials so that only certain mass/charge species may pass [sorted]) • See Exercise 21.4.
Detectors: Mass Spectrometry • A Mass spectrum plots intensity of mass/charge vs. time—could be set a certain retention time in a GC. • Mass chromatogram
Sample Injection and Pretreatment • Gas Sample: if present at moderate to high concentration, may be directly put into column via gas-tight syringe. • Another technique is to use a gas-tight valve: For trace levels like volatile organic compounds (VOC), the sample may need to be preconcentrated by passing it through a solid-absorbing cartridge or using a cryogenic trap.
Sample Injection and Pretreatment • Liquid Samples: direct injection of a relatively large sample (6-10 mL). A calibrated microsyringe may be injected through a gas-tight septum into a heated chamber that volatilizes the sample. • Note that there are direct, split, and splitless column styles. • Sometimes pretreatment requires dervitatization or moving the sample into a different solvent (remove from H2O). • Static or Dynamic Headspace analysis of vapor phase above a sample avoids water in the sample.
Sample Injection and Pretreatment • Solid Samples: First extract compounds of interest from a solid matrix by liquid-liquid extraction or supercritical fluid. Samples are placed in solvent, then treated as liquid samples. • Thermal desorption may be used on some solids as analytes may be collected during heating of a solid. • Pyrolysis GC is employed for substances that are not volatile and cannot be easily derivatized to volatile forms. The solid is heated in a controlled way to break it into smaller, more volatile pieces separated by the column to form a pyrogram, which can be matched to known standards.