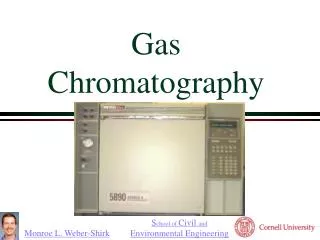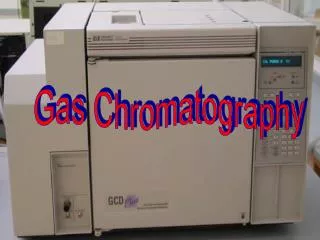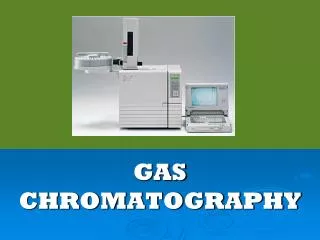
Gas Chromatography
Gas Chromatography. Bioanalytical Chemistry 6 (ASBC600) School of Applied Sciences and Allied Health Christchurch Polytechnic Institute of Technology. Mobile phase – gas Stationary phase GSC (gas solid chromatography) stationary phase is a solid, typically powdered material in short column

Gas Chromatography
E N D
Presentation Transcript
Gas Chromatography Bioanalytical Chemistry 6 (ASBC600) School of Applied Sciences and Allied Health Christchurch Polytechnic Institute of Technology
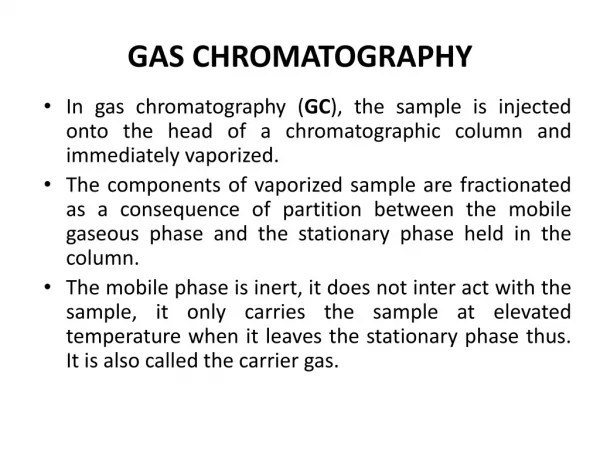
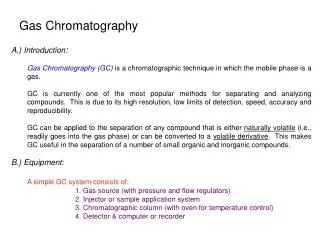
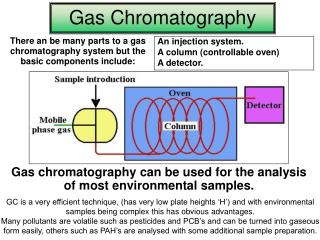
Mobile phase – gas Stationary phase GSC (gas solid chromatography) stationary phase is a solid, typically powdered material in short column GLC (gas liquid chromatography) stationary phase is a liquid coating on a solid support Gas Chromatography -theory
What types of compounds can/cannot be analysed by GC? GC is used for volatile liquids, and gases Must be thermally stable Complex mixtures can be analysed using GLC Gases are often analysed using GSC Examples – determining the composition of petroleum products, essential oils, presence of alcohol in blood, volatile pesticides, environmental contaminants, steroids. Gas Chromatography - Uses
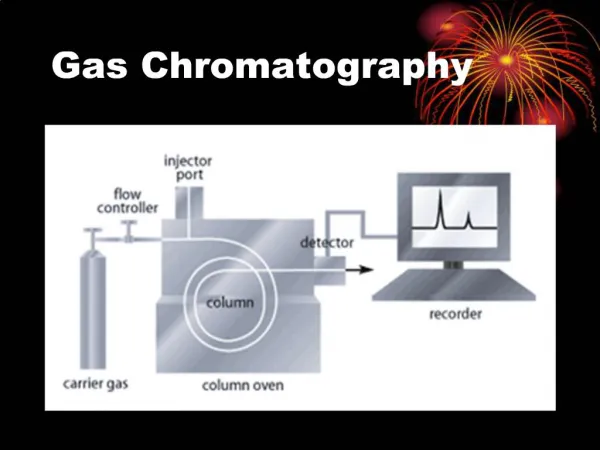
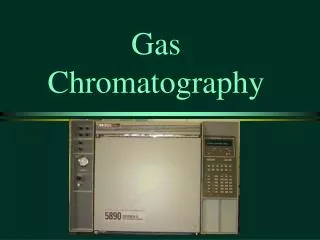
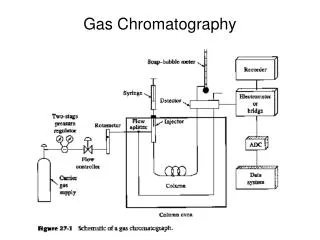
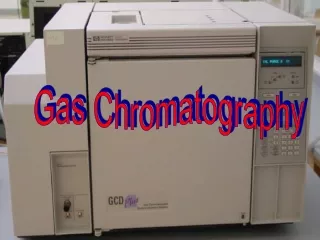
Pressure regulator Injector port Detector Oven Gas supply N2, H2, He Ar Gas Chromatography Equipment Computer/ printer Capillary Column
Pressure regulator Injector port Detector Oven Gas supply N2, H2, He Ar Gas Chromatography Equipment Computer/ printer Capillary Column Why is an oven needed? Maintains constant temperature Why is the pressure regulator important? Maintains constant pressure Constant pressure and temperature help afford reliable results
Capillary Column Packed Column Long and thin. Liquid coating inside (GLC). Resolves complex mixtures. Used for wide range of applications. Short and thick. GSC common. GLC possible. Simple mixtures, esp gases, low b.p. liquids. GC Equipment – Columns The typical dimensions for these types of columns can be found pg 673 – 674 of “Analytical Chemistry” by Skoog et al
Liquid phase (coating inside column) Needs to: 1) be thermally stable 2) have high b.p./low volatility 3) be chemically inert 4) have desirable interaction with compounds being analysed All columns have a maximum operating temperature. Heating a column above this temperature can result in column bleed. What is column bleed and how might you recognise it? Capillary Columns
Many different capillary columns are available, using different liquid phases. When selecting a column for a specific use the most important properties to consider are the maximum operating temperature and the polarity of the liquid stationary phase. For good separation to occur the analyte (and other compounds in the sample) need to interact with the stationary phase. “Like dissolved like” becomes “Like interacts with like” i.e. compounds of similar polarity will take longer to move through the column = long retention time. Capillary Columns
Columns are often classified as being: polar intermediate polarity non-polar (although in fact there is a continuum from polar to non-polar) Separation of compounds requires that the samples differ in terms of polarity and/or boiling point. Capillary Columns
Columns are often classified as being: polar intermediate non-polar (although in fact there is a continuum from polar to non-polar) Separation of compounds requires that the compounds differ in terms of polarity and/or boiling point. Capillary Columns Most important with polar columns Especially important with non-polar columns
Examples of non-polar and polar columns Siloxane based columns are generally considered as non-polar Polyethylene Glycol is a polar column Capillary Columns You are expected to be able to draw these structures from memory
GLC – columns Columns Ph – many drugs, pesticides etc Possess phenyl rings which interact with Ph rings of the stationary phase. Trifluoropropyl group. Fluorine atoms interact with other halogens in pesticides etc 5% Phenyl-polydimethylsiloxane 5% of the R groups are Ph groups 50% Phenyl-polydimethylsiloxane 50% of the R groups are Ph groups The higher the % of Ph the more polar the column becomes. 50% Trifluoropropyl – polydimethylsiloxane 50% of R groups are trifluoropropyl
GLC – columns Column - Uses Dimethylsiloxane - a good general purpose column. Used for analysis of essential oils, solvent impurities, hydrocarbons, pesticides, drugs of abuse (i.e. often relatively low polarity compounds). 50% Phenyl-polydimethylsiloxane - Works well with antidepressants, chlorinated pesticides, herbicides, drugs
A range of different detector systems are available for use with GC. We will look at some of the more commonly used systems. Two factors to consider when choosing a detector are: Sensitivity – highly sensitive detectors can detect very low concentrations of analyte. Selectivity – highly selective detectors will only respond to a small number of analytes. Gas Chromatography Detectors
A range of different detector systems are available for use with GC. The Flame Ionisation Detector (FID) Suitable for organic compounds. When organic compounds burn in a hot flame they produce ions which conduct electricity via electrodes in the detector to produce a detector signal. The Thermal Conductivity Detector (TCD) Suitable for most compounds (universal detector). Detector measures the thermal conductivity of the gas passing through the detector. The presence of compounds typically reduces the thermal conductivity which is measured by the detector. Gas Chromatography Detectors
Flame Ionisation Detector (FID) Suitable for organic compounds. (organic = at least 1 C-H bond) Good sensitivity, 50 ppb Destructive Large linear response, 106 Carrier gas – hydrogen, helium, nitrogen The Thermal Conductivity Detector (TCD) Universal detector Moderate sensitivity, down to 10 ppm Non-destructive Large linear response Carrier gas – helium, hydrogen Detector Comparisons
The key focus regarding detectors in this course will be for you to demonstrate that you have a basic knowledge of how they work, and can identify which detectors are most appropriate for different applications. Gas Chromatography Detectors
The Electron Capture Detector (ECD) Suitable for compounds containing electronegative atoms or groups (e.g. Cl, F, Br, I). see pg 671-672 of Skoog textbook for description Gas Chromatography Detectors
Gas Chromatography – Detectors Electron Capture Detector (ECD) Operating Principle Beta particles from a radioactive element collide with carrier gas particles to produce a large number of secondary, low energy electrons. By placing electrodes with the correct voltage in the detector cavity the secondary electrons can be collected to afford a small measurable current called the “standing current” of the detector. Some sample molecules (in particular those containing halogen atoms) are capable of capturing low energy electrons to form negatively charged ions. This capture process reduces the number of electrons which are collected by the electrodes thereby causing a drop in the standing current. When the sample leaves the detector cell the current returns to the original standing current. Tritium or nickel 63 are common beta particle sources. Tritium (b.p. –250ºC) is adsorbed on a titanium metal foil. Tritium sources are fouled by condensed sample or column bleed (maximum operating temperature is 225ºC). Nickel 63 melts at 1400ºC and the temperature limit for this detector is 350 to 400ºC. Sensitivity – one picogram (10-9 g). For a 1 μL injection this is roughly 1 ppb.
Gas Chromatography – Detectors Electron Capture Detector (ECD) Sensitivity – one picogram (10-9 g). For a 1 μL injection this is roughly 1 ppb. Selectivity – practically no response to common chemicals and solvents but halogens give a very high response which increases from chlorine to bromine to iodine, and compounds containing multiple halogens yield enormous response factors e.g. CCl4. Note -Stationary phases containing halogens should be avoided when using ECD. Some pesticides readily detected using ECD A toxic chlorinated dioxin DDT pesticide (now banned)
Gas Chromatography – Detectors Electron Capture Detector (ECD) ECD detectors also respond to many organophosphorus compounds
Gas Chromatography – Detectors Flame Thermionic Detector (FTD or AFID) Sensitivity - Using Parathion (contains N, P and S) the minimum quantities detected are: Phosphorus mode 10 picograms Nitrogen mode 60 picograms Selectivity – This is a function of the gas flow (sensitive to small changes in the hydrogen flow) and the position of the salt relative to the flame. Applications – Trace drug analysis, organophosphate pesticide analysis. Malathion (insecticide)
Gas Chromatography – Detectors Flame Photometric Detector (FPD) Operating Principle The photoemission from the flame is monitored instead of the electrical conductivity. The sample passes through the hydrogen/air flame and light emission is observed due to the excitation of some of the atoms. This light in the UV/visible region of the spectrum is selected by using suitable filters and is measured by a photomultiplier tube. The light emitting processes that produce the sulfur and phosphorus sensitivity occur in the upper portion of the flame that does not emit appreciably in the absence of sulfur and phosphorus. Selective to compounds containing sulfur and phosphorus.
Gas Chromatography – Detectors Mass Spectrometer This technique will generally provide positive identification. It is a very sensitive but expensive technique. Problems to be overcome in interfacing GC-MS Atmospheric pressure in GC, high vacuum in MS. MS requires smaller flow rate. Enrichment of sample from the GC is required – carrier gas needs to be removed by separator. These problems are generally overcome using capillary GC/MS techniques.
Gas Chromatography – Detectors Comparing Detectors Detector Selectivity Sensitivity Flame Ionisation (FID) organic compounds 5 pg/s Thermal Conductivity (TCD) universal (all compounds) 500 pg/mL Electron Capture (ECD) * halogenated compounds 0.1 pg/s – 0.005 pg/s Flame Thermionic (FTD or AFID) N and P compounds 0.1 pg/s (P), 1 pg/s (N) Flame Photometric (FPD) P and S compounds 1 pg (P), 20 pg (S) Mass Spectrometer (MS) can be non-selective or 1 ng per scan selective (SIM)** * ECD has a limited linear range of about 2 orders of magnitude (i.e. 102) – How would this affect its use? ** Selective Ion Monitoring. The mass spectrometer is programmed to observe only specific ions. Note – the versatility of the MS detector means that it is now being used for a wide range of analyses, even those which previous utilised ECD, FTD etc.
Gas Chromatography – Detectors Comparing Detectors • What would be your detector options in terms of analysing for following analytes? • a) Trace amounts of organosulfur pesticides in food • Chlorinated dioxins in soil • Unknown toxin molecules in a forensic sample • Organophosphates in water • Sulfur dioxide gas in factory chimneys • Organonitrogen pesticides in soil • Detection of explosives (i.e. detecting a wide range of • compounds at high sensitivity) • h) Benzene in petrol • i) Water in petrol
Comparing Different Detectors The gas chromatographs on the following slide are from an analysis of herbal tea which has been spiked with trace amounts of 11 different organochlorine and organophosphorus pesticides (peaks numbered 1 to 11 in the chromatographs). Discuss why there are different numbers of peaks in each chromatograph.
Sample needs to be injected quickly and efficiently to ensure good resolution and sharp peaks. Simplest method involves straight injection of sample (~0.1 to 20 uL) through a rubber septum. Gas samples can be analysed using a gas-tight syringe, although better results are often achieved using a gas sampling valve. Sample Injection
Sample needs to be injected quickly and efficiently to ensure good resolution and sharp peaks. Injection of sample (~0.1 to 20 uL) through rubber septum. Gas samples can be analysed using a gas-tight syringe, although better results are often achieved using a gas sampling valve. cheaper, variable volume Sample Injection Less skill required, more repeatable results
Sample needs to be injected quickly and efficiently to ensure good resolution and sharp peaks. Injection of sample (~0.1 to 20 uL) through rubber septum. Gas samples can be analysed using a gas-tight syringe, although better results are often achieved using a gas sampling valve. Occasionally needs replacing. Why? cheaper, variable volume Sample Injection Less skill required, more repeatable results
GLC – columns Split and Splitless Injection Splitless injection allows all of the sample that is injected into the GC to go onto the column. Useful for dilute samples and trace analysis (i.e. ppm and lower). Split injection allows only part of the sample that is injected into the GC to go onto column. Useful for concentrated samples. Example – GC set to a split rate of 35 means 1/35 of the sample enters the column, the rest of the injected sample is vented from the machine. Animations http://www.restek.com/info_animation_split.asp http://www.restek.com/info_animation_splitless.asp
Before being injected into the gas chromatograph samples often • need to be pre-treated. • This can include: • either dilution or concentration • extraction of volatile analytes from non-volatile matrix • addition of an internal standard. • Some samples need little pre-treatment. The analysis of ethanol in blood or wine needs little preparation because ethanol is the only volatile component. Non-volatile components in the blood or wine are burnt and accumulate just inside the injection port. • When samples are diluted, we use a very volatile solvent (e.g. hexane, dichloromethane). The solvent emerges from the column quickly and is easily recognisable. Sample Preparation
Detector Output Each compound detected by the detector produces a peak (as can be seen in the GC print outs shown below). http://lipidlibrary.aocs.org/GC_lipid/06_gc_spec/index2.htm http://www.wfu.edu/chem/courses/organic/GC/images/analysis.gif
Detector Output What do we usually look at on a GC print out to determine the amount of analyte that is present? What do we look at to determine what the compound is?
Interpreting the GC Print Out Retention time helps with analyte identity Peak area gives the amount of analyte http://www.wfu.edu/chem/courses/organic/GC/images/analysis.gif
Quantitative Analysis • While GC can be used in the qualitative analysis of samples, i.e. • seeing what is present or absent, its most important use is in the • QUANTITATIVE analysis of samples (e.g. ethanol in blood) • Quantitative analysis requires that we have some way of relating • the response of the detector to the amount of analyte present. • TWO COMMON APPROACHES • Preparing a standard curve • Using an Internal Standard • Note these two approaches are also used with other techniques, • including HPLC.
Quantitative Analysis – Std curve • Using Standards • Use a minimum of five standard solutions • Use the results to plot a curve. Normally a straight line. • Any one unusual result can be ignored and not used in the plotting of the curve. More than one and it is appropriate to rerun the experiment with new standards • Unknown solutions should fall within the plot produced by the standards (interpolation). Extending the curve beyond the standard solutions to determine the amount of analyte present in an unknown solution is less reliable (extrapolation). • This is because most detectors only have a finite linear range and extrapolation may result in assuming a linear response when it no longer exists.
Quantitative Analysis – Std curve Title? X axis = concentration Y axis = measured quantity
Quantitative Analysis – Internal Stds This involves the use of two different solutions Solution A – this contains a known amount of the analyte (A) and a known amount of a compound called the internal standard (S) Solution B – this contains an unknown amount of the analyte (which we are trying to determine the amount of) and a known amount of the internal standard Solution A allows us to compare, quantitatively the response of the detector towards the analyte relative to the Internal standard. Once we have determined this difference we can use it to determine the amount of analyte in the solution B. An outline of the calculations required for Internals standards will be given to you as a handout, and also provided on Moodle.
Quantitative Analysis Response factors The same amount of two different compounds will usually produce peaks of different areas because each compound interacts differently with the detector. e.g. the same amount of two different organic compounds will produce different amounts of ions in an FID detector. The compound that produces more ions will give a larger peak on the GC printout. The response factor is a quantitative measure of how well the detector responds to a given compound. Response Factor (RF) = Area of the GC peak amount of substance used The response factor has no given units and the “amount” can be measured in mass (mg) or concentration, so long as it is used consistently.
Quantitative Analysis Relative Response Factors (RRF) To measure the difference in the way two compounds interact with a detector we can calculate the relative response factor (RRF) by dividing one RF by the other. e.g. if toluene has an RF of 1200 and propanol has an RF of 800 then the RRF(t/p) = 1.5 That is, if you were to inject the same amount, say 10 mg, of toluene and propanol into the GC the toluene peak will always be 1.5 times the size of the propanol peak. RRF = RF(compound 1) RF(compound 2) The RRF has no units
Quantitative Analysis – Internal Stds The response factor (RF) for each compound is determined using the following equation: RF = Area (from GC trace)/ Volume Equation 1 so RF(S) = Area(S) and RF(A) = Area(A) Volume(S) Volume(A) Note – mass can be used instead of volume. The Relative Response Factor (RRF) for the two compounds is determined by dividing one of the RF’s by the other. This gives us a ratio by which S and A differ in the intensity (i.e. Area of the peak) they produce. e.g. RRF = RF(S)Equation 2 RF(A)
Quantitative Analysis – Internal Stds A known quantity of the standard (S) is mixed with a known quantity of sample that contains an unknown amount of the compound of interest (A). First calculate the RF(s) using the area due to S and the volume used in preparing the mixture using the Equation 2 from the previous slide RRF = RF(S) therefore RF(A) = RF(S) You have already calculated RF(A) RRF values for these 2 Therefore using RF(A) = Area(A) = RF(S) Volume(A) RFF You now have values for every term except Volume(A) so a simple rearrangement allows calculation of Volume(A) To calculate the percentage of A in the unknown sample The percentage of A in sample = Volume(A)100 Total Sample Volume
Retention time – time taken for the sample to reach the detector following injection. Peaks have good resolution if they do not overlap with other peaks. Column efficiency (N) – the larger this number the better the column will resolve peaks. The longer a column is, the more efficient it becomes. Sometimes referred to as the Number of theoretical plates Linear range – the range of analyte concentrations over which the detector provides a linear response (i.e. a straight line on the graph) Resolution can improved by: increasing gas flow, raising the temperature, changing the column. Gas Chromatography – Key Terms
GC – Specialised Applications Gas Solid Chromatography (GSC) Separation by GSC relies on selective adsorption of the components of the vaporised sample by the stationary phase used. The most common application of GSC is the separation of gases or low molecular weight alkanes and alcohols. Blood alcohol is generally analysed by GSC. A sample of blood is diluted and n-propanol is added as an internal standard. The concentration of ethanol in the blood is determined from the ratio of ethanol/propanol gas chromatograph peak heights and compared with a calibration curve. Carbowax columns are often used.
GC – Specialised Applications Gas Solid Chromatography (GSC) Oxygen and carbon monoxide in car exhaust can be determined by GSC. He or H2 are used as a carrier gas, column temperature 50ºC, TCD detector and a 2 mL sample loop. The adsorbants commonly used in GSC are alumina, silica gel, molecular sieves and porous polymer e.g. Poropak. Molecular sieves separate O2 and N2 but they do not elute CO2 under normal conditions. Silica gel elutes CO2 but does not separate N2 and O2. Poropak is a porous polymer composed of ethylvinylbenzene crosslinked with divinylbenzene to form a uniform structure of distinctive pore size. Poropak can be modified by copolymerisation with various polar monomers to produce beads of increasing polarity. No liquid phase or solid support is used – the solute molecules partition directly from the gas phase into the amorphous polymer.
GC – Specialised Applications Headspace Analysis In a sealed container partially filled with a solution of volatile components the composition of the mixture of vapours above the solution will be such that it is in equilibrium with the solution. Analysing the mixture of vapours will allow the composition of the mixture to be determined. Accuracy is comparable to conventional analysis of the liquid phase but sampling is more easily automated. One advantage of this technique is that the column is not contaminated by non-volatile components of the solution being analysed. Applications – residual solvent in printed packaging films, determination of ethanol in cough syrup. http://www.labhut.com/images/education/headspace/phases_vial.gif
GC – Specialised Applications Pyrolysis Pyrolysis is used for high molecular weight non-volatile substances. Pyrolysis GC (PGC) is applicable to any material that is capable of being thermally decomposed to yield a group of volatile decomposition products some of which can be separated by GC. These are chromatographed to yield a fingerprint which is characteristic of the original material. Pyrolysis is a good technique if the degradation products are reproducible, and unique to the sample. A pyrolyser may be an injection port heater combined with a simple injector. The pyrolyser is fitted to the top of the column in place of the injection head. The products of the pyrolysis are swept into the column before secondary reactions occur. Addition polymers depolymerise easily on modest heating often giving a chromatogram containing a peak due to the monomer with just a few much smaller peaks due to dimers and degradation or rearrangement products. Copolymers give peaks for both monomers. Some polymers give chromatograms which may not be one monomer but can be rationalised e.g. cellulose esters eliminate the carboxylic acid fragment which can be fingerprinted.