Download
1 / 14
140 likes | 288 Views
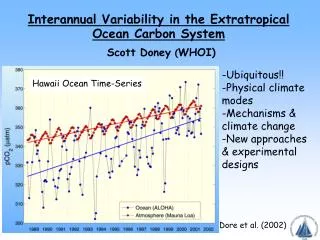
Southern ocean inversions: interannual variability and sink trend. Rachel Law and Richard Matear April 26 2007 CSIRO Marine and Atmospheric Research. Background. Le Qu é r é et al., Weakening of the Southern Ocean sink of CO 2 , revised, awaiting final editorial decision.

E N D
Southern ocean inversions: interannual variability and sink trend Rachel Law and Richard Matear April 26 2007 CSIRO Marine and Atmospheric Research
Background • Le Quéré et al., Weakening of the Southern Ocean sink of CO2, revised, awaiting final editorial decision. • Lenton and Matear, Interannual variability: SAM and CO2 uptake, GBC, in press. • Lovenduski et al., Enhanced CO2 outgassing in the Southern Ocean from a positive phase of the Southern Annular mode, submitted. • Butler et al., Observed relationship between the Southern Annular mode and atmospheric carbon dioxide, submitted to GBC.
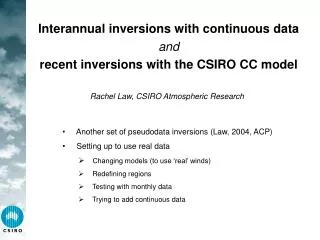
Testing inversion capability • Create pseudo-obs • Run CCAM for 1970-1999 with NCEP nudging • Ocean CO2 from Matear model with NCEP forcing • Biosphere CO2 using model of Friedlingstein et al., GBC, 1995 • Fossil CO2 from C4MIP • Invert using CRC-MATCH • 116 regions • GCM winds (no IAV) • Inversion set-up similar to Baker et al., 2006 including fossil90, fossil95, CASA and Takahashi99 presubs • Use monthly mean CO2 only
Ocean flux (gC m-2 y-1) Matear, 1990-1999 average Takahashi – 1999 version
Region map • Red: Basic network, Black: extra sites
Network choice SPO: F = 0.76 C -0.40, R2=0.47 +PSA: F = 0.89 C -0.41, R2=0.59 +MQA: F = 0.94 C -0.44, R2=0.62 +CRZ: F = 0.95 C -0.44, R2=0.62 +MAA: F = 0.96 C -0.43, R2=0.62 +HBA, JBN, SYO: F = 1.01 C -0.44, R2=0.68
Regional fluxes – North/South split +PSA +CRZ Blue: total Green: South Red: North
Regional fluxes: basin split Blue: Indian, Green: Pacific Red: Atlantic +MQA +PSA
Flux trend from ocean model Linear regression, 10 year segments Blue: trend over 10 years Red: trend over 20 years
Flux trends from inversions 10 year trend 20 year trend NB smaller y-range Red: fluxes from ocean model, blue: inversions
Inversion of observed CO2 Annual mean southern ocean CO2 flux Blue: BRW, SMO, SPO (NOAA) CHR, MLO, SPO, SMO (SIO) Red: + PSA (NOAA) Cyan: +HBA (NOAA) Magenta: +SYO (NOAA) Purple: +MQA (CSIRO) Green: +CRZ (NOAA), MAA(CSIRO) Need to check sensitivity to data uncertainty choice Black : ocean model flux
Trends 10 year trend 20 year trend NB y-range different IAV too large to reliably say anything about trend ??
Conclusions • Inversions of synthetic data suggest that IAV of total southern ocean flux can be retrieved with some skill even with very small networks • Regional information is less certain • Trends appear difficult to interpret given magnitude of IAV • Fluxes from inversion of observed CO2 not very similar to ocean model fluxes. Need to test sensitivity to data uncertainty (and probably other things too).