Download
1 / 17
170 likes | 275 Views
Explore the transformation of Maricopa County's population from 1955 to 2010, and projections for 2040. Discover the impact on urban land use, employment trends, and demographic shifts. Learn from past data to understand future growth patterns in the region.

E N D
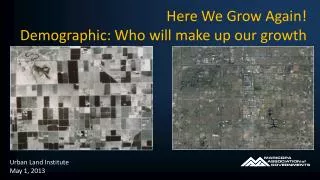
Here We Grow Again! Demographic: Who will make up our growth Urban Land Institute May 1, 2013
1955 Population 470,000 2010 Population 3,800,000 Lessons From the Past Maricopa County Population 1955 AND 2010
Maricopa County Age Distribution Median Age
Maricopa County Population: 2010 and 2040? Projections • 2010 Population • 3.8 Million • 2040? Population • 6.2 Million
Employment Situation Graph 4: Maricopa County - Employment gains/losses (annual change), 2002-2012 Data Source: Office of Employment and Population Statistics, Arizona Department of Administration
Net Migration is Rebounding Increased Mobility – Net Migration in Positive Territory Phoenix-Mesa-Glendale Metro Area Population, Natural Increase and Net Migration Source: Arizona Vital Statistics, Arizona Department of Administration
Draft 2 Review – Subject to Change 30% 12% 6% 34% 14% 14% 25% 14% 15%
Draft 2 Review – Subject to Change 15% 11% 31% 17% 13% 31% 33% 28% 57%
For More Information Contact: Eric Anderson Transportation Director Eanderson@azmag.gov 602.254.6300