Download
1 / 9
90 likes | 176 Views
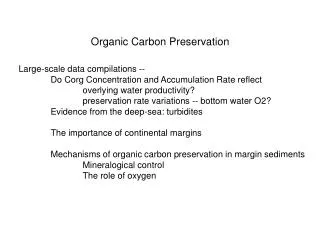
Explore the dynamics of organic carbon transfer from land to ocean in the Waipaoa sedimentary system, focusing on erosion-related losses in Poverty Bay. The study examines OC burial trends and particle size distributions in cores collected from the floodplain and shelf. Investigate how flood events are preserved on the shelf and their impact on OC, the influence of changing terrestrial processes on OC transport offshore, and the potential interchange between terrestrial and marine OC in riverine particles discharged to the ocean.

E N D
Land to Ocean Transfer ofOrganic Carbon in theWaipaoa Sedimentary System Hannah Brackley Landcare Research NZ Ltd
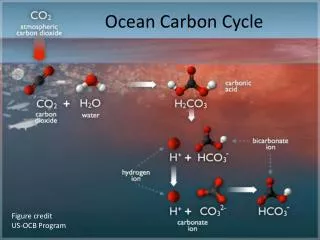
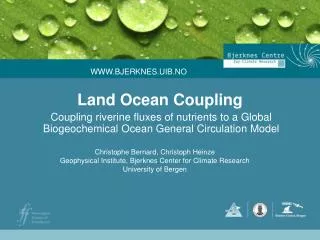
Poverty Bay Shelf Organic Carbon (%) Depth (cm) Introduction Previous research has recognised an increase in OC burial on the Waipaoa River floodplain and Poverty Bay shelf since the arrival of Europeans.
Waipaoa Sedimentary System Cores collected from: • Waipaoa River Floodplain • Poverty Bay Shelf/slope: U2303: • 7.5 km from river mouth • 27 m water depth U2305: • 22.5 km from river mouth • 56 m water depth W697: • 40 km from river mouth • 1200 m water depth
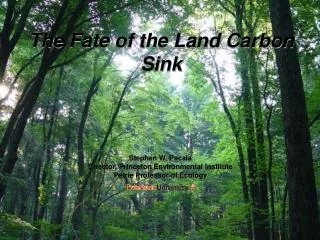
% <4 mm % 4–25 mm % >25 mm U2303 (27 m Water Depth) 1.0 6–7 cm 0.8 0.6 % OC Particle Size Distributions 0.4 0.2 100 0.0 m m m Bulk >25 m 4–25 m <4 m 80 %OC in Size Fractions 18–19 cm 3 60 Cumulative Percent 40 2 % OC 20 1 0 0 6–7 cm 18–19 cm 30–31 cm m m m Bulk >25 m 4–25 m <4 m 1.0 30–31 cm 0.8 0.6 % OC 0.4 0.2 0.0 m m m Bulk >25 m 4–25 m <4 m
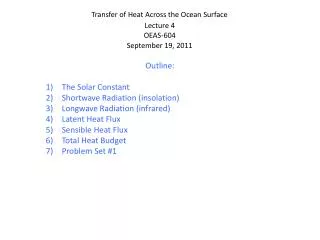
U2303 (27 m Water Depth) 100 6–7 cm 80 60 Weight Percent 40 20 0 m m m > 25 m < 4 m % of Total OC in Sample 4–25 m 60 18–19 cm 50 40 30 Weight Percent 20 10 0 m m m 4–25 m > 25 m < 4 m 100 30–31 cm 80 60 Weight Percent 40 20 0 m m m > 25 m 4–25 m < 4 m
%OC as a Function of Particle Size Floodplain Mid Shelf 27 m Mid Shelf 56 m Upper Slope
d13C Trends from Floodplain to Slope d13C Floodplain Mid Shelf 27 m Mid Shelf 56 m Upper Slope
Questions • How are flood events preserved on the shelf, and how do they influence the OC? • How do changing terrestrial processes influence the amount and character of OC being transported offshore? • Are the riverine particles losing their terrestrial OC when discharged to the ocean, and if so, are they reloading with marine OC?