Download

1 / 25
250 likes | 271 Views
This conference presentation discusses the inter-relationship between population forecasts, economic activity rates, and local planning in order to forecast future labour force dynamics and inform local plans. It also examines past trends and current methods for forecasting economic activity rates at the local level.

E N D
Labour force projections for Districts of Britain Ludi Simpson, University of Manchester TWRI conference, York 9th October 2015
Local planning context -1 • Requires forecast by age and sex of local population (ONS etc), headship rates (DCLG etc), and economic activity rates (no-one) • Their inter-relationship is what local planners and demographers attempt to model and forecast. • migration-led forecasts • Future population age-sex structure->housing, jobs • dwelling-led forecasts • Future housing land -> population age-sex -> labour force • jobs-led forecasts • Future jobs -> population age-sex -> households, housing land
Local planning context - 2 • The Cameron governments’ Planning Guidance has encouraged jobs aspirations in local plans • Jobs attract migration which implies extra housing land • Unless economic activity increases • This application is perhaps the largest practical motivation for forecasts of local authority economic activity • Local jobs aspiration as part of national policy has contradictory implications: • If all local plans fulfilled aspirational plans there would be more jobs everywhere • Economic activity would have to increase • There would be no impact on housing land
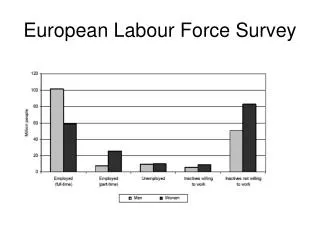
Past economic activity rates, broad age groupsUK, Labour Force Survey
The 10 day challenge • POPGROUP software (Derived Forecasts) provides a structure to implement by age & sex the identity: Labour Force = Population * Economic Activity rate • How to forecast future economic activity rates for all LADs? Options: • Relate the recent local level to a national projection? • Or model locally? Test with 1991-2001-2011 • Which national projection? EU or OBR? • Which local level? Census 2011 or LFS? • User’s subsequent question • When building on a standard economic activity projection: which local scenarios are sensible?
Outline • Methods for labour force forecasts • Current forecasts for the UK or smaller areas • Cambridge Econometrics, Oxford Economics, local plan documents • OBR, EU, ILO for the UK • Data available for local areas • Census 1991-2001-2011 • Test of options: what is stable about local economic activity? • Annual Population Survey/LFS • Tasks seeking researchers • Proposed strategy, under consultation
4 trends observed throughout the EU • “The participation rates of prime-age male workers (aged 25 to 54), at around 90%, remain the highest of all groups. • The participation rates of men aged 55 to 64 years, which had recorded a steady decline in the past twenty five years, are showing clear signs of a reversal in most countries since the turn of the century, mostly due to pension reforms raising the statutory retirement age or the state pension age; • Female participation rates have steadily increased over the past twenty five years, largely reflecting societal trends; • The participation rates of young people (aged 15 to 24 years) have declined, mostly due to a longer stay in school;” European Commission (2014) The 2015 ageing report - Underlying Assumptions and Projection Methodologies, European Economy 8/2014, p30
Economic activity rates, age and sex1971-2011 Censuses, England & Wales 1. High ‘prime age’ participation 2. Reduced older male participation, recently recovered 3. Rising female participation 4. Reduced young participation Males Females
Methods ILO (2011) and OECD (2003) European Commission (2005) among other reviews , identify four strategies: • Judgemental, qualitative – where few data exist and no time series of activity rates. ECB, most local plan scenarios • Time extrapolation of activity rates, including s-curves – where time series exist. Use of s-curves implements an assumption that past change will reduce. Most common. ONS; ILO; USA(BLS) • Regression models based on correlations with economic, cultural, demographic factors. Unusual outside academia. Religion? • Cohort approach based on [net] entry and exit ‘rates’ from the labour force at each age, males and females separately. OECD; EC; OBR • When inactivity decreasing, ‘Entry rate’ = 1 – (Inactivity rate age a+1 time t+1 / Inactivity rate age a time t) • Eg a tenth of 25 year old inactive males become active. • A ‘death rate’ applied to those inactive at time t, the result added to activity age a at time t • When activity is decreasing, ‘Exit rate’ = (Activity rate a+1 time t+1 / Activity rate age a time) • A growth rate applied to those active at time t.
Previous LAD projections • Cambridge Econometrics age-sex- economic activity for LADs, used by Warwick IER’s Working Futures • No documentation • Oxford Economics all-age economic activity as a product of a model of employment • East of England, E. Midlands, Greater Manchester, ... • Unspecific documentation • Local authority and planning agency submissions • Great variety of approaches in reports • Plausible scenarios of future change (judgemental approach) • Impact of State Pension Age rise of X years modelled by shifting activity to that of a younger group by X years (Shropshire and others).
Labour Force forecasts for the UK Only the European Commission projection is available
EC past and projected economic activity, selected age groups Is the European Commission projection too flat for young and elderly? Can it be improved? Is the OBR better, or just different?
Local authority districts: data in Britain for economic activity • APS/LFS – annual up to March 2015 • Sample small for LAD by age and sex • Households plus student halls – not other institutions • Census 1991, 2001, 2011 • 16-19, five-year age groups to 60-64, m/f • Other age groups differ between years and countries • 2011: England 65+, Sc & NI 65-74, 75+ • Data can be made consistent for 2011 geography • Except Scotland 1991
Tests with 348 England & Wales Local Authority Districts 1991-01-11 • What is stable about local economic activity?
CorrelationCorrelationVariation (SD) 348 LADs E&W economic activity LAD’s distance from the average remains similar over time- Students, ex-industrial areas, muslim womenChanges over one decade tended to not to be continued in the next decadeThere has not been convergence over time One census with next Change 91-01 with change 01-11
Tests with E&W districts 1991-01-11 • How well do different strategies estimate 2011 local economic activity, using 1991-2001 data? • 2001 no change • 2001 plus national change (actual 01-11, or repeat 91-01) • 2001 plus local change (repeat 91-01, or cohort) For each strategy: • ‘change’ applied as % points (additive) or as proportion (multiplicative) • Rates not allowed to go beyond 0% or 100% • Accuracy: absolute % point difference with 2011 census
Absolute error for persons 16-642011 economic activity rates, 348 LADs of E&W. E&W mean: 77.9%
Females Males
Summary of testing • Suggested by these tests: • Use a recent local profile, project forward by adding the change in a good national projection • Other results of testing: • Combining strategies did not improve them • Student areas were poorly projected when proportions were changing • Disaggregation to age-sex groups did not improve the estimate of the total 16-64 % economically active
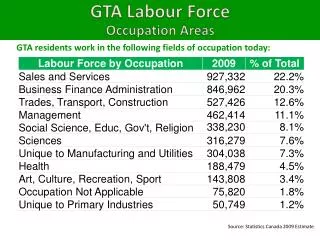
Does the APS provide a better starting point than the 2011 Census? Age 16+ Females aged 50-64 Males aged 16-19 Manchester: economic activity year ending March, 2005-2015, with 95% CI 2011 Census
APS of interest in fast-changing areas, but not of benefit to standard projections Cheshire East: economic activity year ending March, 2005-2015, with 95% CI Age 16+ Females aged 50-64 Males aged 16-19
Tasks seeking researchers • Serious national forecast • 5-year age-sex cohort history for UK • Time series analysis of period and cohort rates • Separate student population and its activity • Quality assured and documented to National Statistics standards • Local scenarios: review of data, methods, performance, and promotion of best practice • Measure uncertainty, post-hoc distribution of errors, and probabilistic derived projections • Which characteristics of LAs might identify groups which can be best projected together? • Regions, socio-economic types, religious composition • Refinement of a first standard LAD projection
Conclusions, consultation • Conclusions • Use the 2011 census LAD age-sex economic activity • Commission table for 5-year age-sex groups to 70-74 and 75+ • Project forward by adding the change in a series of scenarios based on UK data • Scenarios, not the best UK projection • Alternative Default sheets in POPGROUP’s Derived Forecasts • Start with 2001, simple linear interpolation to 2011
Consultation • Scenarios • Constant based on the latest local value • The OBR projection if released – can it be reconstructed? • The EC projection • Extrapolate 16-24 recent change: is there evidence of how it will develop? • Extrapolate 55+ recent change. (a) logistic regression, (b) adding the extra impact of a rise in SPA of one year by shifting EA rates one year • Move women’s rates to equal those of men, or to be as closely equal as has been achieved by the most equal European country • All rates by a specified annual increment: in effect altering the total economic activity • Other queries • APS/LFS, can it be used in a standard way locally? • Are there other standard local adjustments to the projection?