Download
1 / 39
390 likes | 408 Views
Quarterly Labour Force Survey (QLFS). Pali Lehohla Statistician General Statistics South Africa. Introduction. Concerns raised about the LFS Reliability of data Six monthly frequency Lack of timeliness Coverage Evaluation and recommendations in June 2005

E N D
Quarterly Labour Force Survey (QLFS) Pali Lehohla Statistician General Statistics South Africa
Introduction Concerns raised about the LFS • Reliability of data • Six monthly frequency • Lack of timeliness • Coverage • Evaluation and recommendations in June 2005 • Decision to re-engineer the LFS Aug 2005 • Re-engineering process supported by ILO and international consultants
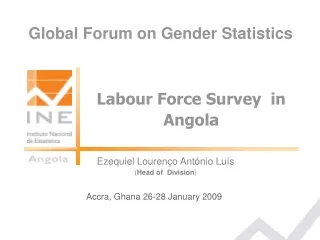
Consultations • International Labour Organisation – on going • SADC and East African Countries (Dec 2006) • Key stakeholders (Dec 2006, June 2008) • Other stakeholders (March 2006, June 2008) • Statistics Canada – on going
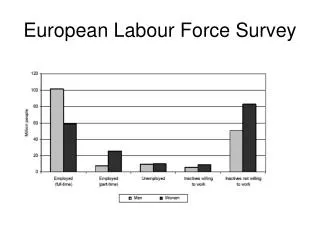
Background QLFS is a quarterly continuous household survey: • It measures the three components of the labour market • Employed • Unemployed • Not economically active • It also measures related aspects of the labour market • Industry • Occupation • Sector • Hours of work • Discouraged work-seekers and reasons for such etc., The unemployment rate is an important indicator of current economic activity (data collected through the QLFS)
How the QLFS was conducted • Representative sample of 30 000 dwelling units across the country was visited • Detailed information collected from over 60 000 adults of working age (15–64 years) • Face-to-face interviews conducted for each household visited
Structure of the QLFS questionnaire Cover page Fieldwork details to enable the tracking of questionnaires etc., Section 1 Socio-demographic questions about ALL household members. Individual questionnaire for each of 6 respondents 15 yrs and older Section 2: Determines which respondents are employed and which respondents are not employed. Section 3: Determines which respondents are unemployed and which respondents are not economically active (inactive). Section 4: Determines various aspects of the situation of employed persons only. Persons engaged in non-market production activities are routed to the unemployment and not economically active questions in Section 3
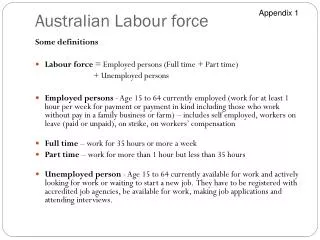
Key labour market concepts and definitions Working age population (15-64yrs) • Employed • Work for pay, profit or family gain • Not economically active • Not available to work • Available to work but no active steps taken to look for work (incl discouraged work-seekers) • Unemployed • Available to work & have taken active steps to look for work Labour force /economically active
How the unemployment rate is calculated Unemployed X 100 Unemployed + Employed (the labour force)
Key reporting changes • 15-64 years instead of 15-65 years for greater international comparability • Employment includes only market production activities • Non-market production activities in separate table • Discouraged work-seekers comprise only those whose reason for not seeking work was any of the following: lost hope of finding work; lacked relevant skills or qualifications; no work available in the area • Informal sector comprises: • Employers, own-account workers and persons working unpaid in their household business ( where the business is not registered for VAT or income tax) • Employees (not registered by their employers for income tax and working in enterprises of less than 5 employees)
The informal sector in the QLFS Employed Employers; Own-account; Working unpaid in hhold business Employees Income tax deducted by employer Registered for VAT or Income tax No No Size of establishment less than 5 employees Yes Informal sector
Discouraged work-seekers in the QLFS Job search activities in the last 4 weeks No Wanted to work the previous week Yes • Reasons for not trying to find work or start business last 4 weeks: • No jobs available in the area • Unable to find work requiring his/her skills • Lost hope of finding any kind of work Availability to start work/business the previous week Yes No Discouraged Other NEA
Key labour market indicators, Q1:2008 & Q2:2008 Quarterly changes: Employed up by 106 thousand (0,8%). Unemployed down by 77 thousand (1,8%), Discouraged down by 98 thousand (8,3%)
Employment (Market production activities only)
Employment by industry More than half the additional jobs (71 out of 106 thousand) in community and social services. Trade accounts for the highest number of jobs 3,1 million or 22,6% of total employment in Q2
Employment by occupation Elementary jobs account for the largest share (3,1 mill or 22,8% of total employment in Q2). The increase in elementary jobs accounted for 75 out of 106 thousand additional jobs
Employment in the formal and informal sector Quarterly employment gains of 106 thousand are largest in the formal sector (up 73 thousand or 0,8%). Informal sector is 17,0% of total employment:
Employment in the formal and informal sector, Q2:2008 Trade is the most important industry accounting for 46,1% of employment in the informal sector
Unemployed by sex The quarterly fall in unemployment was largely among men
Long-term unemployed The quarterly decline in unemployment was due to a reduction in short-term unemployment (by 112 thousand or 6,1%). But persons in long-term unemployment account for over half of all unemployed persons (58,5% in Q2)
Unemployment rate by province (%) The largest quarterly difference in the unemployment rate was in EC (down 3,3 percentage points)
Unemployment rate by population group (%), Q2:2008 African women have the highest unemployment rate (31,1%) relative to the other population groups
Characteristics of the not economically active Students account for the largest number of NEA 5,7mill in Q2 (44,1%). Discouraged work-seekers had the largest quarterly decline (98 thousand or 8,3%)
Involvement in non-market production activities (activities for own final use) Fetching water or collecting wood/dung is the most important non-market activity followed by subsistence farming. The vast majority of persons in non-market activity were NEA
Historical revisions to LFS Based on the overlap between LFS 17 (March ’08) and QLFS Q1:2008 (Jan-Mar) (Detailed report published as a separate document)
Key labour market indicators revised Employment Revised series shows higher employment than originally published
Key labour market indicators revised (Percent) Unemployment Revised series shows lower unemployment than originally published
Key labour market indicators revised (Percent) Not economically active Revised series shows lower economic inactivity than originally published
Key labour market indicators revised Unemployment rate Revised series shows lower unemployment rates than originally published
Various sources of the differences • Non-market activities excluded from employment in QLFS • Different sequences (persons in market not asked about non-market activities) • Different instruments (shorter core & less respondent fatigue) • Continuous vs point-in-time • Individual questionnaires within one book • Permanent staff in QLFS vs contract field-staff in LFS • Different population benchmarks Impossible to disentangle various elements
Announcement Additional aspects of the QLFS results to be introduced as follows: • Time-related underemployment – Sep 2008 • Measures of underutilisation of labour – Sep 2008 • Characteristics of the unemployed: - Oct 2008 • New entrants • Job-losers • Job-leavers • Re-entrants • Informal employment – Oct 2008