Download
1 / 35
430 likes | 829 Views
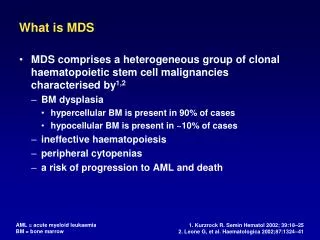
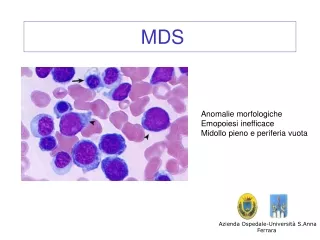
What is MDS. MDS comprises a heterogeneous group of clonal haematopoietic stem cell malignancies characterised by 1,2 BM dysplasia hypercellular BM is present in 90% of cases hypocellular BM is present in ~10% of cases ineffective haematopoiesis peripheral cytopenias

E N D
What is MDS • MDS comprises a heterogeneous group of clonal haematopoietic stem cell malignancies characterised by1,2 • BM dysplasia • hypercellular BM is present in 90% of cases • hypocellular BM is present in ~10% of cases • ineffective haematopoiesis • peripheral cytopenias • a risk of progression to AML and death AML = acute myeloid leukaemiaBM = bone marrow 1. Kurzrock R. Semin Hematol 2002; 39:18–25 2. Leone G, et al. Haematologica 2002;87:1324–41
Incidence of MDS in Western Europe • In 2008, the incidence of MDS was estimated to be 2.3–6.5 cases per 100,000 people per year in Western Europe1 • The reported incidence is higher in Germany and Spain compared with the rest of Western Europe • this may be due to • differences in diagnostic methods2 • differences in age distribution in different countries3 • The increase in incidence of MDS over time observed in some studies may reflect improvements in geriatric medical care and diagnosis of haematological malignancies4 Incidence of MDS in Western Europe in 20081 7 6 5 4 3 2 1 0 Incidence per 100,000 people France UK Germany Italy Spain 1. Data from The Mattson Jack Group Inc, A Kantar Health Company, 2008 2. Germing U, et al. Haematologica 2004;89:905–10 3. World Health Statistics, 2008. Available at www.who.int/whosis/whostat/EN_WHS08_Table6_Demography.pdf 4. Aul C. Int J Hematol 2001;73:405–10
Incidence of MDS in a reference population, Düsseldorf, Germany • Approximately 3.7–6.1 new diagnoses of MDS/year per 100,000 population (1991–2001) • median age at diagnosis: 72 years • incidence (per 100,000) • all: 4.9 • men: 5.5 • women: 4.4 Germing U, et al. Haematologica 2004:89;905–10
Incidence of MDS increases with age Age-specific incidence rates (per 100,000) <50 years 0.5 50–59 years 5.3 60–69 years 15 70–79 years 49 ≥80 years 89 89 90 80 70 61 59 60 52 50 Incidence of MDS per 100,000 40 30 26 20 16 9 10 4 2 2 2 1 0 30– 35– 40– 45– 50– 55– 60– 65– 70– 75– 80– 80+ Age (years) Williamson PJ, et al. Br J Haematol 1994;87:743–5
IPSS: distribution of risk groups in a retrospective study of 816 patients with MDS High 7% Low 33% Int-2 22% Int-1 38% Greenberg P, et al. Blood 1997;89:2079–88
Primary and secondary MDS • Primary (de novo) MDS • the most common form of MDS (approximately 80–90% of cases)1,2 • the majority of cases are idiopathic1 • occasionally cases can be familial/genetic1 • occasionally arises from previous haematological disease1 • Secondary MDS • approximately 10–20% of cases2 • the majority of patients have chromosomal abnormalities2 • occurs following exposure to chemotherapy or radiotherapy (especially alkylating agents, epipodophyllotoxins, anthracyclines)3 • has a rapid course and poor prognosis3 1. Understanding MDS – a primer for practicing clinicians, MDS Foundation Resource Center Available at: www.mdsresourcecenter.org. Accessed 11 Feb 2009 2. Pedersen-Bjergaard J, et al. Blood 1995;86:3542–523. Flandrin G. Classification of myelodysplastic syndromesAvailable at: http://atlasgeneticsoncology.org/Anomalies/ClassifMDSID1239.html. Accessed 11 Feb 2009
Multistep pathogenesis of MDS1,2 Insult Alterations I Alterations II DNA methylation Tumour suppressors Decreased apoptosis Mutations Cell cycle Increased apoptosis Transcription checkpoints Chemical Radiation Cytotoxic Genetic Normal Clonal MDS early MDS late AMLstem cell haematopoiesis All DNMT isoforms may contribute to aberrant methylation in MDS3 1. Hofmann W-K. Cancer Treat Rev 2007;33(Suppl 1):S42–6 2. Grövdal M, et al. Clin Cancer Res 2007;13:7107–12 3. Hopfer O, et al. Leuk Res 2009;33:434–42 DNMT = DNA methyltransferase
Heritable Constitutional genetic disorder trisomy of chromosome 8 due to mosaicism familial monosomy of chromosome 7 Neurofibromatosis type 1 Embryonal dysgenesis Congenital neutropenia Kostmann agranulocytosis, Shwachman–Diamond syndrome DNA repair deficiency syndromes Fanconi anaemia, ataxia telangiectasia, Bloom syndrome Mutagen detoxification (GSTq1-null) Acquired Senescence Mutagen/genotoxic stress therapeutic use of alkylating agents or topoisomerase-II-interactive agents radiotherapy (e.g. β-emitters [32P]) autologous BM transplantation exposure to certain chemicals (e.g. benzene) tobacco Aplastic anaemia Paroxysmal nocturnal haemoglobinuria Aetiological factors for MDS can be heritable or acquired List AF, Doll DC. In: Lee RG, et al. eds. Wintrobe’s Clinical Hematology. 10th ed. 1999:2320–41
Cytogenetic abnormalities and epigenetic changes are key drivers of MDS pathogenesis Direct environmental toxicity1 Stromal/angiogenic factors2 Epigenetic changes e.g. DNA hypermethylation3 Immune dysfunction1,2 MDS Stem cell dysfunction Cytogenetic abnormalities/DNA damage1 Impaired apoptosis1 1. List AF, Doll DC. in: Lee RG, et al. eds. Wintrobe’s Clinical Hematology. 10th ed. 1999:2320–41 2. Greenberg PL, et al. Hematology Am Soc Educ Program 2002;136–61 3. Leone G, et al. Haematologica 2002;87:1324–41
DNA hypermethylation: a key driver in the pathogenesis and progression of MDS • The extent of DNA hypermethylation in BM mononuclear cells is higher in patients with highrisk vs low-risk MDS1 • DNA hypermethylation plays a key role in progression from MDS to AML2 • in particular, hypermethylation of p15INK4b has been shown to be strongly associated with progression to AML1,3 1. Tien HF, et al. Br J Hematol 2001;112:148–54 2. Jiang Y, et al. Blood 2009;113:1315–25 3. Aggerholm A, et al. Eur J Haematol 2006;76:23–32
In patients with MDS, median OS correlates with methylation status of p15INK4b 100 80 60 40 20 0 Median OS = 18 vs 48 months (p=0.049, log-rank test) OS (% patients) Unmethylated p15INK4b Methylated p15INK4b (n=33) (n=20) 0 20 40 60 80 100 120 140 Time (months) Quesnel B, et al. Blood 1998;91:2985–90 OS = overall survival
Aberrant DNA methylation is more frequent than chromosome aberrations in MDS Aberrant methylation Chromosome lesions Chromosome number Jiang Y, et al. Blood2009;113: 1315–25
Ineffective haematopoiesis causes peripheral cytopenias in patients with MDS Cell lineage affected in MDS Granular leukocytes Non-granular leukocytes White blood cells Adapted from Bondurant MC, Koury MJ. Origin and development of blood cells. In: Lee RG, et al. eds. Wintrobe’s Clinical Hematology. 10th ed. 1999:2320–41 Anaemia Thrombocytopenia Neutropenia
Anaemia occurs in 60–80% of patients with MDS1 • MDS-associated anaemia (haemoglobin level <10g/dL)1 is • chronic2 • often macrocytic3 • associated with fatigue and exacerbation of heart failure2,3 • Patients with MDS-associated anaemia often become dependent on blood transfusions leading to iron overload2 • Transfusion dependence is associated with • organ damage4 • decreased OS compared with patients who do not require multiple transfusions (p<0.001)5 • The annual cost of treating anaemia is estimated to be approximately $41,000/year/patient (transfusions plus iron chelation therapy)6 1. Greenberg P, et al. Blood 1997;89:2079–88 2. Cazzola M, et al. Hematology Am Soc Hematol Educ Program 2008:166–75 3. Greenberg PL, et al. Hematology Am Soc Hematol Educ Program 2002:136–61 4. Cazzola M, et al. Blood 1988;71:305–12; 5. Malcovati L, et al. J Clin Oncol 2005;23:7594–6036. Greenberg PL, et al. J Natl Compr Canc Netw 2008;6:942–53
Thrombocytopenia occurs in 40–65% of patients with MDS • The prevalence of thrombocytopenia increases with IPSS risk classification • a retrospective review (all patients with MDS referred to the University of Texas MDACC since 1980) reported the frequency of thrombocytopenia in each IPSS risk group: • low risk = 20% • intermediate-1 risk = 64% • intermediate-2 risk = 72% • high risk = 82% • Haemorrhagic complications of thrombocytopenia are one of the leading causes of death in patients with MDS Kantarjian H, et al. Cancer 2007;109:1705–14 MDACC = M.D. Anderson Cancer Center
Neutropenia occurs in 50–60% of patients with MDS1 • MDS-associated neutropenia leads to a high incidence of potentially life-threatening infection,2 including • bacterial infections2,3 • sepsis3 • invasive aspergillosis3 • Neutropenia-related infection is the principal cause of death in patients with MDS2 1. Greenberg PL, et al. Hematology Am Soc Hematol Educ Program 2002:136–61 2. List AF, Doll DC. in: Lee RG, et al. eds. Wintrobe’s Clinical Hematology. 10th ed. 1999:2320–41 3. Pomeroy C, et al. Am J Med 1991;90:338–44
Patients with MDS report their disease negatively impacts on their QoL • Responses were assessed from 128 patients with MDS involved in 10 forums discussing QoL issues • Patients reported that their disease negatively impacted on • daily functioning • physical energy • independence • interpersonal relationships • role within family • emotional wellbeing • personal time • employment Patients’ ability to perform daily activities (n=128) 3% 6% 15% 16% 35% 25% Normal Carries on with normal life, with minor symptoms Takes an effort to engage in normal activities Cares for self but does no active work Requires occasional assistance with personal needs Requires considerable assistance QoL = quality of life Heptinstall K. Oncology (Williston Park) 2008;22:13–8
Low Int-1 Int-2 High Low Int-1 Int-2 High OS is inversely related to risk classification (IPSS) 100 80 60 40 20 0 Survival (% patients) n=267 n=179 n=314 n=56 0 2 4 6 8 10 12 14 16 18 Time (years) Time (years) Greenberg P, et al. Blood 1997;89:2079–88
Approximately 30% of patients with MDS progress to AML1 • AML is characterised by uncontrolled proliferation of blasts and disrupted haematopoiesis, leading to bone marrow failure2 • Progression from MDS to AML is considered to have occurred when the proportion of BM blasts exceeds 20% (WHO classification system) or 30% (FAB classification system)1 • Risk factors for transformation to AML include: • >10% BM blasts3,4 • RAEB or RAEB-T, compared with RA or RARS (FAB classification)3,4 • complex karyotype (≥3 abnormalities) or chromosome 7 abnormalities3,4 • multiple cytopenias3,4 • transfusion dependence5 FAB = French–American–British RA = refractory anaemia RARS = refractory anaemia with ringed sideroblasts RAEB = RA with excess of blasts RAEB-T = RAEB in transformation WHO = World Health Organization 1. Mufti GJ, et al. Haematologica 2008;93:1712–7 2. Plass C, et al. Semin Oncol 2008;35:378–87 3. Greenberg PL, et al. Hematology Am Soc Educ Program 2002:136–61 4. Greenberg P, et al. Blood 1997;89:2079–88 5. Malcovati L. Leuk Res 2007;31 (Suppl. 3):S2–6
Low Int-1 Int-2 High Progression to AML is inversely related to risk classification (IPSS) 100 90 80 70 60 50 40 30 20 10 0 n=235 Patients not progressed (%) n=171 n=295 n=59 *measured as time for 25% of patients to progress to AML 0 2 4 6 8 10 12 14 16 18 Time (years) Greenberg P, et al. Blood 1997;89:2079–88
FAB system: introduction • In 1980, pathologists from France, the USA and Britain met to derive the first classification of MDS • The FAB system categorises MDS into one of five subtypes based on cytomorphological abnormalities, and BM and peripheral ‘blast counts’ • refractory anaemia (RA) • RA with ringed sideroblasts (RARS) • RA with excess blasts (RAEB) • RA with excess blasts in transformation (RAEB-t) • chronic myelomonocytic leukaemia (CMML) Bennett JM, et al. Br J Haematol 1982;51:189–99
FAB system: categories • With the FAB system patients with >30% BM blasts are diagnosed as having AML PB = peripheral bloodN/A = not applicable Bennett JM, et al. Br J Haematol 1982;51:189–99
FAB system: OS based on a retrospective analysis of 816 patients with MDS 100 90 80 70 60 50 40 30 20 10 0 RARS (n=125) RA (n=294) CMML (n=126) RAEB (n=208) RAEB-t (n=61) Survival (% patients) 0 1 2 3 4 5 6 7 8 9 10 11 12 13 14 15 16 17 18 Time (years) OS = overall survival Greenberg P, et al. Blood 1997;89:2079–88
WHO system: categories • With the WHO system, patients with ≥20% BM blasts are diagnosed as having AML . Vardiman JW, et al. Blood 2002;100:2292–302
WHO system: OS based on a retrospective analysis of 467 patients with MDS 100 80 60 40 20 0 RA/RARS (n=110) RCMD/RCMD-RS (n=93) RAEB-1 (n=59) RAEB-2 (n=72) AML (n=47) Survival (% patients) 0 20 40 60 80 100 120 140 Time (months) Malcovati L, et al. J Clin Oncol 2005;23:7594–603
From FAB (1982) to WHO (2001) FAB subgroup1 WHO subgroup2 RA RA RCMDMDS del(5q)MDS-U RA <5% blasts RARS RCMD-RS RARS <5% blasts RAEB-1 RAEB-2 RAEB 5–20% blasts CMML 5–20% blasts Mixed MPD/MDS disorders RAEB-t 21–30% blasts AML Separate category, ≥10% of MDS Therapy-related MDS 1. Bennett JM, et al. Br J Haematol 1982;51:189–99; 2. Vardiman JW, et al. Blood 2002;100:2292–302
IPSS: introduction • In 1997, an International MDS Risk Analysis Workshop was convened to improve pre-existing systems used for evaluating prognosis in MDS • particularly through refined BM cytogenetic classification • Cytogenetic, morphological and clinical data were evaluated from seven studies that used previous independent risk-based systems to assess patients • critical prognostic variables were then re-evaluated to develop the IPSS • The major variables predictive of survival and progression to AML were • cytogenetic abnormalities • percentage of BM blasts • number of cytopenias Greenberg P, et al. Blood 1997;89:2079–88
IPSS: risk classification Greenberg P, et al. Blood 1997;89:2079–88
IPSS: distribution of risk groups in a retrospective study of 816 patients with MDS High 7% Low 33% Int-2 22% Int-1 38% Greenberg P, et al. Blood 1997;89:2079–88
Low Int-1 Int-2 High Low Int-1 Int-2 High IPSS: OS based on a retrospective analysis of 816 patients with MDS 100 80 60 40 20 0 Survival (% patients) n=267 n=179 n=314 n=56 0 2 4 6 8 10 12 14 16 18 Time (years) Time (years) Greenberg P, et al. Blood 1997;89:2079–88
Cytogenetic abnormalities: frequency in a dataset of 2,124 patients with MDS • Of 2,072 patients successfully evaluated, 1,084 (52.3%) were found to have clonal abnormalities 350 300 250 200 150 100 50 0 Singular abnormality Abnormality present + one additional aberration Abnormality present within complex karyotype Number of cases –21 +Mar del(12p) del(5q) del(11q) del(20q) –Y Inv/t(3q) –5 –17/del(17p) –7/del(7q) trisomy(8) t(5q) t(7q) –18/del(18q) trisomy(21) trisomy(11) –13/del(13q) trisomy(1/1q) Cytogenetic abnormality Haase D, et al. Blood 2007;110:4385–95
Cytogenetic abnormalities: prognostic subgroups based on a dataset of 1,202 patients with MDS Haase D. Ann Hematol 2008;87:515–26

![What is Multidimensional Scaling [MDS] ?](https://cdn2.slideserve.com/4259744/what-is-multidimensional-scaling-mds-dt.jpg)


![What is Multidimensional Scaling [MDS] ?](https://cdn5.slideserve.com/9558171/what-is-multidimensional-scaling-mds-dt.jpg)