Download
1 / 38
380 likes | 402 Views
This study provides an in-depth analysis of magnetic high-frequency instabilities in RFP plasmas, focusing on various modes and their impact on plasma behavior. It includes details on instabilities such as edge-resonant modes, Alfvén eigenmodes, and microtearing modes, with implications for plasma stability and confinement. The research involves sophisticated diagnostic setups and observations to understand the complex nature of these instabilities.

E N D
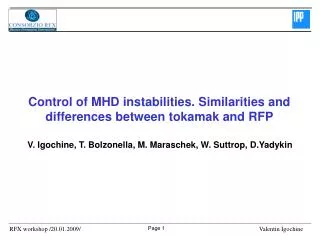
Characterization of micro and macro-instabilities in RFP plasmas M. Zuin S. Spagnolo, I. Predebon, F. Sattin, F. Auriemma, M. Gobbin, R. Cavazzana, A. Fassina, E. Martines, R. Paccagnella, M. Spolaore, N. Vianello, D.A. Spong2, and the RFX-mod team Consorzio RFX, Associazione EURATOM-ENEA sulla Fusione, Corso Stati Uniti 4, I-35127 Padova, Italy 2Oak Ridge National Laboratory, Oak Ridge
Outline Characterization of magnetic high-frequency instabilities: Bp Bt • Edgeresonantmodes • m = 1 / n ~ +30 0
Outline Characterization of magnetic high-frequency instabilities: Bp Bt • Edgeresonantmodes • m = 1 / n ~ +30 0 • ShearAlfvéneigenmodesaround q=0 surface • m=1 / n = 0
Outline Characterization of magnetic high-frequency instabilities: Bp Bt • Edgeresonantmodes • m = 1 / n ~ +30 0 • ShearAlfvéneigenmodesaround q=0 surface • m=1 / n = 0 • Core resonantmicrotearingmodes • m = 1 / n ~ - 200
The RFX-mod reversed field pinch Major Radius 2 m Minor Radius 0.46 m Max Plasma Current 2 MA Max Toroidal Magnetic Field 0.7 T Pulse duration 0.5 s
The diagnostic set-up Systems of in-vessel 120 magnetic coils measuring the time derivative of the three components of the magnetic field: b’r probes: 1 x 8 b’p probes: 1 x 8 b’t probes: 2 x 48 + 1 x 8 in various radial, poloidal and toroidal positions (behind the graphite tiles). - Sampling frequency 1MHz; bandwidth ≤ 400kHz.
The diagnostic set-up Systems of in-vessel 120 magnetic coils measuring the time derivative of the three components of the magnetic field (b’r, b’p, b’t) in various radial, poloidal and toroidal positions (behind the graphite tiles). +Insertable edge electromagnetic tri-axial magnetic probes (17) • sampling rate: up to 10 MHz • probe location: r/a~1 • Coils distance: 20 mm High mode numbers estimation: m ≤ 16 n ≤ 350 q f r ∼ 20mm
Fluctuating magnetic components Bp br bt Bt bp 0 High magnetic fluctuation up to 200 kHz, mainly on the magnetic components perpendicular to the edge magnetic field dBF ≈ dBr eip/2 >> dBq
Edge resonant modes Shallow F m = 0 Deep F m = 1 m=1 edge resonant modes on dBf signals with spectral properties and amplitude depending on the equilibrium m=0 m=1 m=1 Zuin NF 2010
Pressure driven edge modes: tearing parity • Predicted linearly unstable (pressure driven) by the ETAW code • These modes have been recently recognized to have tearing parity. Paccagnella PoP 2013, Ebrahimi PoP 2002 ETAW code EXP. Total amplitude dB/B is up to 1% in deeply reversed plasmas (enhanced field line stochastization)
Bp Bt 0 • ShearAlfvéneigenmodesaround q=0 surface • m=1 / n = 0
Shear Alfvén waves (in ohmic plasmas) dBp (~ dB//) spectra
Shear Alfvén eigenmodes in ohmic plasmas dBp (~ dB//) spectra Alfvèn large-scale (n=0, w=k//vA) eigenmodes are found to be almost ubiquitous in the ohmic RFX-mod plasmas.
Shear Alfvèn eigenmodes in ohmic plasmas These modes have been associated to the presence of a minimum of the Alfvèn continuum at the edge: Global Alfvén eigenmodes (GAE) w = k||vA E D GAE No continuum damping, destabilization mechanism to be identified (possible role of self-generated past particles). TAE
Alfvén eigenmodes in helical ohmic plasmas dBp (~ dB//) spectra A family of Alfvèn eigenmodes have been observed as discrete peaks in the dBp spectrum during helical states => 3D codes (Stellgap)
Helical states and transport barriers Ip multiple helicity MH single helicity SHAx n >7 n=7 (deformation x 10) SHAx • One helical magnetic axis (SHAx, Single Helical Axis) spontaneously forms at high Ip levels (>1.5MA) • Reduced chaos • el. Internal electron barrier eITB MH Lorenzini et al. Nature Phys. 2009
Microtearing modes predicted to become (linearly) unstable, flux tube GS2 code Predebon et al. PRL10 • The microtearing (MT) mode is a high wave number drift-tearing mode driven unstable by the electron temperature gradient, (the long-wavelength counterpart is essentially current driven). • MT modes can lead to chains of magnetic islands, whose overlapping brings to local stochastization of magnetic field lines => effective contribution to the thermal diffusivity through electron parallel motion along the wandering field lines.
Tearing nature of such instabilities: • odd parity for the electrostatic potential • even for the parallel magnetic vector potential A// Predebon et al. PRL10
MT modes are characterized by a propagation in the electron diamagnetic direction • Growth rates get larger for higher values of a/LTe and b. Not MT Predebon et al. PRL10
Te (eV) r/a Fluctuating magnetic components br (andbt)would be the perfect component to study microtearing modes, but edge measurements are strongly affected by edge-resonant resistive modes Bp Bt bp is much less affected by edge modes: bp ≈ b// 0 br bt bp
Frequency and k-space spectra The magnetic fluctuation spectra dbp are very reach, but the various components are well separated in Fourier space (f,k) l ∼ 5 ri
bf(1/7) [mT] A broad peak in the power spectrum around 100 kHz forms during “some” of the SHAx phases SHAx crash “standard” 130 150 170
A* bf(1/7) [mT] A broad peak in the power spectrum around 100 kHz forms during “some” of the SHAx phases SHAx 130 150 170
Experimental wavelength determination These values correspond to a resonant condition: q(rres)=m/n, rres/a ≈ 0.6 i.e. in the region of the maxTe By means of the 2-point technique applied on close signals we measure: (m,n) ∼ (15,200) l ∼ 5 -10 ri IDD EDD Zuin et al. PRL 2014
Gyrokinetic linear stability analysis Gyrokinetic flux-tube code GS2 [1] Dedicated linear gyrokinetic calculations • Microtearing modes linearly unstable • Wavelengths (ky) strongly depending on the shear • Good agreement: exp. g spectrum - (saturated) exp. spectrum [1] http://gs2.sourceforge.net
The amplitude depends on plasma parameters • LTe=Te /Te determines the amplitude of the high frequency modes, along withb • No clear a/LTe threshold
The helical structure toroidally rotates so that the steep temperature gradient (convex side) is alternatively close and far w.r.t. the measuring probe. HFS LFS HFS and LFS anti-correlated
Te (eV) r/a Microtearing spectra evolution k = k⊥ ≈ 100 - 50 m-1 Bp Bt l ∼ 5 ri 0
GS2: effect of the shear on MT spectra Strong effect of the time evolution of the magnetic shear ŝ on the spectral properties of microtearing modes is predicted by gyrokinetic analysis on experimental equilibria ŝ ≈ -0.5 ŝ ≈ -0.5 Spontaneous evolution of the q profile ŝ ≈ -2 ŝ ≈ -2 n m
Microtearing and heat diffusivity cMT Drake et al. PRL 1980 Rechester and Rosenbluth PRL 1978 High Te → estimated cMT consistent with experimental findings
LTe=Te /Te The estimated threshold for the destabilization of MT is in agreement with the observed dynamics of the eITB → marginal stability, critical gradient This suggests a role played by MT on determining ce Microtearing and heat diffusivity cMT Drake et al. PRL 1980 Rechester and Rosenbluth PRL 1978 High Te → estimated cMT consistent with experimental findings Carraro NF2013
Isotopic effect on micro-instabilities Microtearing modes are induced by electron dynamics, but at scales determined by ion Larmor gyration. No strong isotopic effect expected on MT linear stability k┴ri ~ const.
Conclusions • High frequencymagneticspectra in RFP plasmas are extremelyrich • Presence of small-scale tearing-likemodes (likely to induce stochastization) can stronglyaffect the energytransportproperties • A variety of Alfvéneigenmodes in the absence of externalheatingsystemscouldgivehints on particlephysics (spontaneousparticleenergization)
SHAx, t = 227 ms, #30856(color coding indicates toroidal mode number) n = 0 mode family n = 1 mode family n = 0,±7, ±14, ±21, ±28 m = 0 to 5 for n ≥ 0 and m = 1 to 5 for n < 0 n = ±1,±6, ±8, ±13, ±15, ±20, ±22, ±27, ±29 m = 0 to 5 for n ≥ 1 and m = 1 to 5 for n ≤ -1
Field line tracing: the overall magnetic field is built by superposing a large population of predicted MT modes. The code allows to compute the Eulerian spatial correlation: C(l)=<b(l)b(0)>/<b2(0)> and then the correlation length Lc Heat transport ensues only in the presence of appreciable field line stochastization. - Chirikov criterion: m > m0 = q / (2 |q’| ri)1/2 ~ 3 .