UCSB Marine Climate Observations
200 likes | 326 Views
This document outlines the extensive marine climate observations conducted by UCSB researchers in the Santa Barbara Channel since 1996. Key studies involve the Plumes & Blooms program, focusing on bio-optics and changes in ocean color, as well as long-term monitoring of giant kelp forests and their ecological dynamics. Observations include physical and biological parameters, satellite data acquisition, and comprehensive studies on fish and invertebrate recruitment. The research aims to understand the effects of climate change on marine ecosystems and inform management practices.

UCSB Marine Climate Observations
E N D
Presentation Transcript
UCSB Marine Climate Observations Dave Siegel, Libe Washburn, Dan Reed, Carter Ohlmann, Melanie Fewings, Jenn Caselle, Mark Brzezinski University of California, Santa Barbara
UCSB Marine Climate Obs • Plumes & Blooms - bio-optics • Siegel PI - 1996 to present • Santa Barbara Coastal LTER - kelp forest • Reed PI - 2000 to present • PISCO - fish/invert recruitment • Caselle/Gaines/Warner - 1999 to present • PO Observatory - HF radar, shallow moorings • F3 - Modeling of connectivity in SoCal Bight • UCSB/UCLA collaboration
Stormwater Plumes WiFS-LwN(555) February 15, 1998 - El Niño Floods
Plumes & Blooms Program • Understand, predict & utilize changes in ocean color in the Santa Barbara Channel • Monthly day cruises (7 stations) • Field observations started in 1996 (future = ??) • Measurements • CTD/optics (LwN(l), a(l), b(l), bbb(l), PSD, etc.) • NUTs, Chl, HPLC pigments, DOC, DIC, pSi, etc. • Satellite acquisition & analysis • Shortly glider observations…
PnB Sampling Program Cross-channel SST (Station 1 off Campus Point) Station 4 Profile (channel center) www.icess.ucsb.edu/PnB
The SBC-LTER Conceptual Framework From current SBC LTER proposal (sbc.lternet.edu)
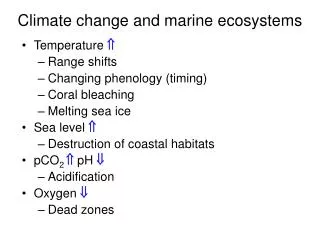
Climate change effects on giant kelp forests • Long-term measurements • Primary production: • Giant kelp biomass, stoichometry, & net primary production • monthly at 3 sites since 2002 • Community structure and foodweb dynamics • Abundance and diversity of algae, invertebrates and fish • annually at 11 sites since 2001 & twice per season at 4 sites since 2009 • Environmental variables measured • Temperature, nutrients, salinity, bottom irradiance, swell ht. & period • ranges from minutes to months since 2000 depending on variable • Notable findings • Disturbance from waves overwhelms bottom-up and top-down forcing of net primary production by giant kelp • Increases in the frequency of intense wave disturbance simplifies kelp forest food webs by preferentially removing foundation species
Regional Kelp Dynamics in the SB Channel (1984-2009) Landsat 5 assessment of giant kelp canopy biomass 30 m spatial resolution Validated with SBC LTER biomass (R2 = 0.65) CV = 87% Regional Giant Kelp Biomass Biomass (kg) El Nino El Nino mean
AQUE Occupancy % MOHK Occupancy % Enables kelp forest assessments on range of scales Landsat 5 is still operating…
West coast surface current mapping network - nearly continuous coverage along US west coast - hourly observations - 2-6 km spatial resolution - time series length to ~10 yr - coverage extends ~150 km offshore - most data available online
Physical Oceanographic Data Sets Collected at UCSB • HF radar surface currents (SCCOOS, not shown) • Partnership for Interdisciplinary Studies of Coastal Oceans/ • NOAA Channel Islands National Marine Sanctuary • 1999-present, ~15-m isobath • Water velocity (ADCP), T, larval settlement • Santa Barbara Channel LTER • 2001-present, 8-15-m isobath • Water velocity (ADCP), T, S, pressure, • nutrients, chl, +... • Plumes and Blooms • ~Monthly CTD casts, optical profiles • Other PO Data Sets • Used at UCSB • QuikSCAT satellite wind stress • NOAA NDBC buoy winds/waves, • airport meteorology • Sea level (NOAA tide gauges) • Coastal temperatures (NOAA) • Santa Barbara Channel/Santa Maria Basin • Study, Scripps/Minerals Management Service • 1992-2004 • Water velocity, T, S, Bottom Pressure
PISCO Kelp Forest Monitoring • SCUBA surveys of all dominant organisms in kelp forests • (fishes, inverts, algae & habitat) • - Annually since 1999 • Includes size structure and recruitment of fishes and select invertebrates • Inside and outside of MPAs www.piscoweb.org
PISCO Settlement and Recruitment monitoring • SMURFs (Standardized Monitoring Units for Recruitment of Fishes), brushes, tuffies and other artificial collectors: sample fishes, urchins, crabs, mussels • Biweekly sampling since 2000 • April-November • Other sites in So Cal & Cen Cal have been sampled over the years by partners www.piscoweb.org PISCO
Flow, Fish & Fishing Biocomplexity • Examine interconnections among flow, fish stocks & fishing in the SoCal Bight - Siegel, Costello, Kendall, Gaines & Warner • Key: quantify nearshore connectivity • Off-line Lagrangian experimentation for 1996 to 2008 • Collaboration with Dong & McWilliams [UCLA]
Flow, Fish & Fishing Biocomplexity From Watson et al. MEPS [2010] • Enables spatial fishery/conservation modeling, analysis of roles of connectivity in community structure & pop genetics, etc. • Integral part of the MPLA’s MPA assessment for SoCal Bight