Download

1 / 40
410 likes | 647 Views
Child Obesity. What is the family physician’s role? Sheryl Rosenberg Thouin, MPH, RD, CDE. Health Consequences of Childhood Obesity. Hypertension Hypercholesterolemia Increased risk of impaired glucose tolerance, insulin resistance and type 2 diabetes. Sleep apnea Asthma

E N D
Child Obesity What is the family physician’s role? Sheryl Rosenberg Thouin, MPH, RD, CDE
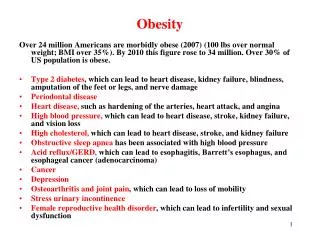
Health Consequences of Childhood Obesity • Hypertension • Hypercholesterolemia • Increased risk of impaired glucose tolerance, insulin resistance and type 2 diabetes. • Sleep apnea • Asthma • Joint problems and musculoskeletal discomfort • Fatty liver disease, gallstones, and GERD • Obese children and adolescents have a greater risk of social and psychological problems, such as discrimination and poor self-esteem, which can continue into adulthood • Becoming obese Adults
2007 Rates of Overweight and Obese Children http://childhealthdata.org/learn/NSCH
BMI • = weight (kg)/height (m)2 • = weight (lb)/[height (in)]2x 703 • BMI is an effective screening tool • For children, BMI is age and gender specific
Indicators of Pediatric OverweightPlotting BMI-for-age Obese >95th percentile Overweight 85th to 95th percentile
For Children, BMI Changes with Age BMI BMI Example: 95th Percentile Tracking Age BMI 2 yrs 19.3 4 yrs 17.8 9 yrs 21.0 13 yrs 25.1 Boys: 2 to 20 years BMI BMI
Example: “Sam” • Name: Sam • Weight: 35 lbs 4 oz • Height: 35 inches • Age: 4 years old • BMI: 20 Is this child normal weight?
BMI BMI Boys: 2 to 20 years BMI BMI Sam’s BMI Plotted on Boy’s BMI-for-Age Chart • Interpretation: • Sam’s BMI-for-age is significantly above the 95th %tile
BMI BMI Boys: 2 to 20 years BMI BMI If Sam were 11.5 years old... • Interpretation: • Sam’s BMI-for-age is just below the 85th %tile
BMI BMI Boys: 2 to 20 years BMI BMI If Sam were 18 years old... • Interpretation: • Sam’s BMI-for-age is just above the 10th %tile
Looking for the Cause • Genetics • Biological factors: hormonal and neurochemical mechanisms • Growth hormone • Leptin • Ghrelin • Neuropeptide Y • melanocortin • Psychological factors • Socio-cultural factors • Environmental factors
Looking for the Cause • Genetics • Biological factors: hormonal and neurochemical mechanisms • Growth hormone • Leptin • Ghrelin • Neuropeptide Y • melanocortin • Psychological factors • Socio-cultural factors • Environmental factors
Data Description Comparisons are made among four groups of 9- to 11-year-old children using federal poverty level and CalFresh participation (Table 1). Only statistically significant differences are reported (p<.05). Data Sources 1 California Department of Public Health, Network for a Healthy Table 1: Categorization of Children California, 1999-2009 California Children’s Healthy Eating and Exercise Practices Survey (CalCHEEPS). Background and Documentation: 2009 CalCHEEPS. www.cdph.ca.gov/programs/cpns/Documents/REU-CalCHEEPSBackground_and_ Documentation2009.pdf. Accessed April 7, 2011. 2 California Department of Education. DataQuest: 2009-2010 Free or Reduced Price Meals Data. http://data1.cde.ca.gov/dataquest/. Accessed April 7, 2011. This material was produced by the California Department of Public Health’s Network for a Healthy California with funding from USDA SNAP, known in California as CalFresh (formerly Food Stamps). These institutions are equal opportunity providers and employers. CalFresh provides assistance to low-income households and can help buy nutritious foods for better health. For CalFresh information, call 1-877-847-3663. For important nutrition information, visit www.cachampionsforchange.net.
Low-income children are more likely to be overweight. 1 fact Nearly two out of five children in California are overweight or obese. The rate is over 60 percent higher among children from very low-income homes compared to those from average and higher income households. Over half of these children are overweight and of those, up to two-thirds are already obese.
Children do not get the recommended amount of physical activity. 2 fact Fewer than half (48%) of the 9- to 11-year-old children in California meet the guideline to engage in at least 60 minutes of moderate and vigorous physical activity daily. Only two out of five (40%) children who reside in very low-income CalFresh households meet this guideline.
Children eat too few fruits and vegetables. 3 fact Fewer than one out of three (31%) California children meet the fruit recommendation for good health and only one in ten (9%) eat the recommended cups of vegetables.
Low-income children get more screen time. 4 fact Children from lower income households spend up to 30 minutes more daily watching television and playing video or computer games compared to children from average and higher income homes. They are up to 50 percent more likely to have a television in their bedroom. California children with televisions in their bedrooms average 30 minutes more screen time and are 20 percent less likely to meet the recommended two or fewer hours a day of screen time, when compared to children without a television in their bedroom.
More parents can be role models for a healthy lifestyle. 5 fact Almost two-thirds of children who reside in CalFresh households agree that their parents eat high calorie, low nutrient foods compared to about two-fifths of the children from other groups. California children who agree with this statement report more daily servings of high-fat snacks (0.9 vs. 0.7 servings) and high calorie, low nutrient foods (3.8 vs. 3.3 servings), compared to those who disagree. Parents and other adults can support healthy eating by being role models.
Few low-income children participate in organized sports to support an active lifestyle. 6 fact Low-income children are up to 50 percent less likely to participate in organized sports. California children who participate in organized sports are 34 percent more likely to meet the physical activity recommendation on a typical day. Organized sports, offered outside of the school day, support physically active lifestyles among low-income children.
Many students get high calorie, low nutrient foods as rewards in the classroom. 7 fact Just under half of California children report that their teachers reward students by giving out high calorie, low nutrient rewards like candy, cookies, chips, or soda.
Higher participation in the school breakfast program may help increase fruit and vegetable intake. 8 fact Children participating in school breakfast average 0.6 to 1.3 servings more fruits and vegetables in every survey year from 1999 through 2009.
Low-income children have less access to nutrition lessons. 9 fact Children from average and higher income households are up to 27 percent more likely to report access to nutrition lessons at school compared to children from lower income homes.
School nutrition lessons empower children tomake healthy food choices. 0 1 fact Participating in nutrition lessons at school is positively related to fruit and vegetable consumption in most survey years.
The physician’s role:AAFP Prevention of Pediatric Overweight and Obesity • Calculate and plot BMI once a year in all children and adolescents. • Encourage parents and caregivers to promote healthy eating patterns • Encourage children’s autonomy in self-regulation of food intake and setting appropriate limits on choices; • Encourage modeling of healthy food choices. • Routinely promote physical activity, including unstructured play at home and in school; • Recommend limitation of television and video time to a maximum of 2 hours per day. • Recognize and monitor changes in obesity-associated risk factors for adult chronic disease, such as hypertension, dyslipidemia, hyperinsulinemia, impaired glucose tolerance, and symptoms of obstructive sleep apnea syndrome.
The Division of Responsibilityadapted from Ellen Satter, MSW, RD Parental Responsibilities What is accessible What food is available When kitchen is open/closed When food is available TV/computer/cell phone time Where food is consumed What beverages are allowed Physical activity/play time Being a nutrition role model All adults on ‘same page’ Child Responsibilities How much is eaten How their body turns out
Parental Feeding Responsibilities: • Establish predictable eating schedules. • Determine when kitchen is open/closed. • Plan the same menu for all family members. • Involve the child in meal planning/preparation/label reading • Modelpositive eating behaviors. • Enthusiastic about new foods • Focused eating • Slow-paced • Make exercise part of daily life. • Limit media viewing/video games. • Provide non-food rewards. • Parents ARE NOT responsible for: • How much the child decides to eat • Child’s eventual body size
Helpful Assessment Questions • When did the excessive weight gain • Any major events/changes in the child’s life at that time? • What is the child eating? • Beverages? • Where does eating take place? • Does the child eat with the family? • At a table? • When does eating take place? • Who is in charge of food decisions? • Is the television on during meals? Snacks? • Who is in charge of TV/computer/video game time? • Are weekends different?
Recommended Resources • www.dietconsultpro.com • www.medi-diets.com • www.ellynsatter.com