Download
1 / 15
160 likes | 373 Views
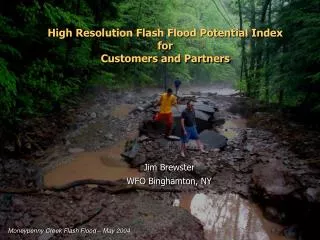
High Resolution Flash Flood Potential Index for Customers and Partners. Jim Brewster WFO Binghamton, NY. Moneypenny Creek Flash Flood – May 2004. Background. Flooding is WFO Binghamton’s #1 High Impact Hazard Central NY and Northeast PA have highly variable geography, land cover and use.

E N D
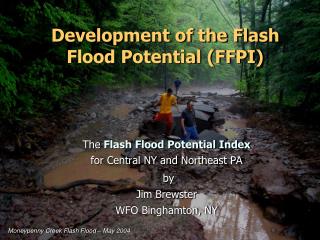
High Resolution Flash Flood Potential IndexforCustomers and Partners Jim Brewster WFO Binghamton, NY Moneypenny Creek Flash Flood – May 2004
Background • Flooding is WFO Binghamton’s #1 High Impact Hazard • Central NY and Northeast PA have highly variable geography, land cover and use. • Steep, rocky terrain along with flatter sandy plains • Areas of urbanization • Wide range of forest cover • Similar soil types • Experienced forecasters realized that some areas are more prone to flash flooding than others. • But, Where and to what extent?
Flash Flood Potential Index (FFPI) • Developed by hydrologist Greg Smith, CBRFC (2003). • Geographical features play a key role in flash flooding • Developed as background information to be incorporated into production of better gridded Flash Flood Guidance • Using the FFPI, the roles of land, vegetation and urbanization in flash flooding are visualized • “Guesswork” to the flash flood problem is reduced
Methodology for creating FFPI • Collected available geographic data sets • Used GIS technology to resample, project and index the data into to a common value • Mathematically develop a new geographic index grid…the FFPI
The Data • Four geographic data sets : • Slope derived from the USGS DEM (Digital Elevation Model) • MLRC Land Use/Land Cover Grid • AVHRR Forest Density Grid • STATSGO Soil Type Classification
Methodology Review • Weight average the geographic layers. • FFPI = (1.5*Slope + LC + Soils + Forest)/N • Local adjustment to calculation • Reviewed against historical events • Flash flooding occurs in our forested areas. • Is that element really much of an influence here? • FFPI = (1.5*Slope + LC + Soils + 0.5*Forest)/N • Raw grid is then averaged to individual basins.
90 Meter Resolution • Warm colors = High Potential • Cool colors = Low Potential
FFPI mapped to FFMP Basins • Fit our historical events • New realizations, especially the low FF potential areas. • Differentiates the “best of the worst” basins in an area generally known for high flash flood potential.
FFPI Versatility • Exportable to other platforms • KML/KMZ • GeoTiff • Google Earth • ESRI shape file
High Resolution in Action November 16, 2006 Flash Flooding & Mud slides
90 m - High Resolution Glen Brook Fatalities Use of high resolution FFPI in a GIS environment can benefit emergency managers, planning boards, town highway departments, and other local officials and groups.
Summary • The FFPI was developed in Binghamton due to the important need to have a static geophysical reference grid which better illustrates how local earth system features contribute to flash flooding. • The FFPI is best used in flood operations when mapped to our AWIPS FFMP basins for comparison with other flash flood tools and techniques. • Through GIS technology, the index can be exported to many formats for use by other government agencies, customers and partners for planning and mitigation. • Please send requests for GIS FFPI layers to james.brewster@noaa.gov