Download
1 / 19
190 likes | 223 Views
Explore the use of GIS models and Flash Flood Potential Index for effective flash flood management. Learn about FFG generation methods and factors influencing flash floods.

E N D
Call Outline • CBRFC Flash Flood Guidance (credit: Greg Smith) • CBRFC Distributed Model Project (credit: Ed Clark) • FFMP Enhancements (OCWWS: Mary Mullusky) • WFO Best Practices
Geospatial analysis of known flash flood events used to create a GIS model for computing FFG Northwest California - Nevada Rules of thumb – skewed and given spatial variability based on the GIS generated flash flood potential index (FFPI) WR produced training 2007 training module describing FFG from each of the three WR RFCs: www.wrh.noaa.gov/wrh/hydro_science/wr_ffg/ This training augmented FFG module produced by COMET WR RFC FFG Generation Methods: Empirically based legacy method – skewed and given spatial variability based on the GIS generated flash flood potential index (FFPI). Colorado Basin
Many channels and dry washes duplicate as high use recreational trails. • Due in part to the varied terrain and soil types flash floods are not constricted to existing channels. ThreshR/FFGS Application Limitations . . . • Precipitation intensity, basin geography and physiographic features have greater influence than antecedent soil moisture. Western Region Flash Flood Factors . . . • Flash floods are generally localized, short-duration events associated with heavy rain. • Flash floods frequently occur in small basins generally less than 20 square miles in size. • Flash floods occur rapidly, on at time scale less than 1 hour. • SAC-SMA calibrated basins are much larger in size than flash flood basins. • SAC-SMA operates on time scales much greater than the flash flood time scale. • It is very difficult to determine a critical flash flood flow/stage level required by ThreshR. • SAC-SMA calibrations do not exist across the entire RFC area. • Due to the limitations listed – resulting FFG using SAC-SMA requires significant modification.
Land Use ? Soil type Vegetation type and density Slopes The Flash Flood Potential Index uses information such as land-use, forest density, slope, and soil type to characterize an areas potential response to heavy rainfall
1 10 FFPI Method Creating a single FFPI layer Hydrologic response 7 3 Slope Greater response and potential 7 8 3 Forest Density Lesser response and potential 3 6 4 Land Use 4 9 6 Soil 9 Flash Flood Potential Index
Decreasing Potential Increasing Potential FFPI in a Gridded Format East Fork of the Virgin River Southwest Utah FFPI 1 10
Inputs: Approximately 10-Year 1, 3, and 6 hour return period precip amounts determined by empirical relationships and bounded by WFO forecast zones – This is the starting point for FFG. Outputs: Gridded FFG that is modulated by the FFPI for input into the FFMP 1, 3, 6, hour flash flood guidance issued by WFO forecast zone in a text product format CBRFC FFG Method: Combination of an empirically based legacy method and the GIS based flash flood potential index. Empirical In Nature – Based On Historical Observations Palmer Drought Index (PDI)– Used to skew FFG values (soil moisture effect). The PDI application has minimal influence resulting in FFG changes by approximately +/- .10 inch. Gridded FFPI - Used to adjust FFG on a grid-cell by grid-cell basis to create greater spatial resolution in FFG and account for physiographic characteristics.
Palmer Drought Effect While the PDI isn’t ideally suited for this application it is a hold-over from an older method and was an attempt to account for soil moisture. Within the CBRFC application the PDI accounts for less than a .20 change in the original FFG value.
CBRFC FFPI Multiplication Factors: The FFPI values range from 1 to 9 with a mean value for the CBRFC near 4 • if FFPI = 1: FFG multiplication factor is 1.50 • if FFPI = 2: FFG multiplication factor is 1.30 • if FFPI = 3: FFG multiplication factor is 1.20 • If FFPI = 4: FFG multiplication factor is 1.0 • If FFPI = 5: FFG multiplication factor is .90 • If FFPI = 6: FFG multiplication factor is . 85 • If FFPI = 7: FFG multiplication factor is .75 • if FFPI = 8: FFG multiplication factor is .70 • if FFPI = 9: FFG multiplication factor is .65
CBRFC Flash Flood Guidance Influenced by the Flash Flood Potential Index
What about wildfire burn scars? The Oxnard and Sand Diego WFOs within the CNRFC area in California receive threshold FFG values from the USGS. These values are then input into FFMP using the forced-FFG option The CBRFC has modified FFPI values within wildfire burn areas in a test mode. Upon regular receipt of burn area information it is anticipated this will become an operational practice.
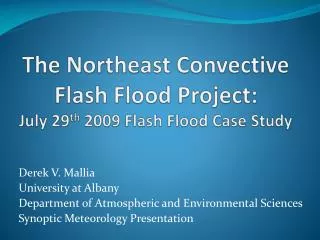
Distributed Model and Flash Floods • Ultimately we want to model flash floods directly…. • Long term effort beginning in Tucson area this and next summer
Proposed Methodology: Hydrologic Threshold Frequency Response • Run the historical observed precipitation through the Hydrologic Lab – Research Distributed Hydrologic Model (HL-RDHM) saving grids of discharge and surface flow for each hour. • Establish the hourly distribution of discharge and surface flow for each cell. • Run the model in real-time, sub-hourly, with quality controlled QPE and very-short-term QPF (e.g. NMQ or WFO generated) to produce the discharge and surface flow grids. • For each grid cell, compare the value to the distribution of values and assign the exceedence category. • Identify critical runoff values regionally and locally to determine flash flood occurrence.
Operational Flood Threshold Frequency Concept For Each Cell… Critical Threshold Frequency Runoff Grid of Discharge Discharge Exceedence values
Improvements over existing FF Programs • Explicit, real time, modeling of flash flood events. • Continuous model maintains soil moisture states. • Model is connected – flows routed from cell to cell to show impacts in areas downstream from the precipitation event. • Indicates where significant flows (e.g. flash floods) are occurring or could occur based on each cell’s hydrologic distribution. • In time, WFO forecaster short-term storm projections can be used to derive quantified stream response. • Begins to bridge the gap between traditional RFC river forecasts and the Flashflood program.
CBRFC WFO Meeting • September 4 • Salt Lake • Attendees: • SH or HFP (CBRFC AHPS $$ can cover travel) • One (or more) other WFO rep (e.g. WCM, SOO, or MIC) • Agenda (to be fleshed out this summer) • Highlight new CBRFC developments • Meet new personnel • Discuss service concerns • Etc • Please send any input to me