Download
1 / 57
570 likes | 752 Views
LUNG CANCER OMICS. VLADIMIR LAZAR MD, PhD Director of IGR’s Genomic Centre and Integrated biology platform vladimir.lazar@igr.fr. 2 nd ,Quebec conference on Therapeutic Resistance in Cancer Montreal, November 6th, 2010. Cost in metastatic NSCLC. Lung cancer overview 170 000 cases in USA

E N D
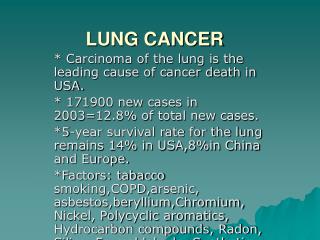
LUNG CANCER OMICS VLADIMIR LAZAR MD, PhD Director of IGR’s Genomic Centre and Integrated biology platform vladimir.lazar@igr.fr 2nd ,Quebec conference on Therapeutic Resistance in Cancer Montreal, November 6th, 2010
Cost in metastatic NSCLC • Lung cancer overview • 170 000 cases in USA • 380 000 cases in Europe • At diagnosis 70% are metastatic • Overal survival at 5 Years <15% Erlotinib >2 m. COST-EFFECTIVEMESS 20 18 Pemetrex. > 2 m. 16 Erlotinib 2 m. Cetux.or bev. >2 m. 14 Pemetrex 2 m. Erlotinib 2 m. 12 Bev./Cet 2 m. Pemetrex 2 m. Docetax. 2 m. 10 Overall survival (median) 8 Platinum + 3rd gen. 8–10 m. Platinum + 3rd gen. 8–10 m. Platinum + 3rd gen. 8–10 m. Platinum + 3rd gen. 8–10 m. Platinum + 3rd gen. >10 m. 6 Cisplatin ‘old fashion’6–8 m. 4 BSC 2–4 m. 2 0 70’s 80s 90s 2000 2005 2007-8 2013
Improve therapy Patients with same diagnosis Other treatments Non responders Toxicity Responders with standard therapy Goals of tailoring therapy according to predictive markers Gandara R, et al. J Clin Oncol, 2007: Abst 7500
30 Classic Strategy for biopsies collection / analysis • 1 biopsy per patient, before treatment • Cohort responders non responders • Corelate data with end point and Tumor 10% • Noise linked to the wide interindividual variability • (genetic background, sexe, organ, tumor type….) • need of large sample size, >>100 • (e.g MINDACT Clinical trial >6,000 patients) • Not compatible with limited number of patient. • List of gene obtained instable, not able to predict clinical benefit. Genetic Variability 90% noise Histologic preparation Michiels S, et al. Lancet. 2005 - Prediction of cancer outcome with microarrays: a multiple random validation strategy. Michiels S, et al. Br. J. Cancer 2007 - Interpretation of Microarray Data
31 IGR sequential Biopsies program « 2 biopsies , before/after treatment » Tumoral versus normal tissue • Avoid inter-individual variability • (same patient, same genetic background, same tumour type…) • Advantage dual-fluorescence labeling • (direct comparison) Drug effect on Tumor 85% • Preliminary studies • 5 couples of biopsies analyzed in duplicate & dye-swap. • SD of log of l’exp° « before » et « after » (SD1= 1,6) • SD of log of l’exp° « before/after »(SD2=0,4) • =>sample size needed to detect the same difference with « t-test » • « usual» Strategy n= 86 • « Sequential Biopsies » Strategy n=5 • Tumor versus normal = individual studies noise
Expression BEFORE short name=CD69 short name=CD69 1000000 1000000 100000 100000 10000 10000 1000 1000 P= 0.8654 100 P= 0.0012 100 No response Response Response No response Ratio of expression BEFORE/AFTER 10.0 Expression Ratio 1.0 P=7.5E-12 0.1 No response Response 32 Example IGR’s Team project Expression AFTER Mantle cell lymphoma Sequential Biopsies Proteasome inhibitor
SOP pain, anxiety and risk management Radiologie-Interventionnelle team (Dr T De BAERE)
FNA 18 gauges 23 gauges • HISTOLOGIC control ON CYTO • Lysis buffer (DNA, RNA Proteins) • Highcontent in tumoral cells in breast tumors, • metastatic lymph nodes,lymphomas • Possible cell suspension biopsies 18 gauges Control radio/echo • SNAP FROZEN VS RNA LATTER • HISTOLOGY CONTROL • RISK OF MIRROR ADJACENT BIOPSY • Variable % of tumoralcells • Need suplementary QC
ANOVA Repondeur /NRepondeur (4 5 8 / 1 3 7) 114 genes, p10-10
P4B + P4T Profils similaires, à la dynamique près (amplitude supérieure pour P4B).
6th PCRD Coordinator Pr Johan Hanson Karolinska Instituted IGR – Genomic workpackage Chemores : the first fully integrated Omics project in Lung cancerperformed with dual biopsies strategies T versus normal tissue
Comparisons Each patient TUMOR VS normal Tissue,( certified by histology control>85%, unique quality) • Groups: • To compare • Group 1 vs 2 (prognostic + predictive) • Group 3 vs 4 (prognostic) • Interaction: (1-2) vs (3-4) = predictive biomarkers • To compare • Tumor versus normal in ADK and SCC (early diagnosis) • Individualized estimation of resistance and of sensitivity
Lung cancer overview • 170 000 cases in USA • 380 000 cases in Europe • At diagnosis 70% are metastatic • Overal survival at 5 Years <15% • Early diagnosis ( compare T vs normal lung tissues) • Serum biomarkers –target secreted proteins • Enhancing sensitivity of imaging –target receptors • Predict efficacy of treatments • Populational studies (dissociate prognostic and predictive biomarkers • Individualized selection of treatment • Switch to integrative medicine (P4 medicine)
Molecular data • DNA • CGH (comparative genomic hybridization): measures copy number. Agilent 250K array • Methylation array: measures gene silencing. (Tumor-suppressor genes are often silenced.) • Full sequencing of candidate genes (1,000 genes) • RNA • Exon expression array. Agilent 244K array. Average 8 exons/gene. • microRNA. Affects mRNA-protein translation. Agilent array~800miRNA. • Protein • LC/MS method
Clinical data • N=123 patients • table(Relapse, Adj.chemo) Adj.chemo Relapse 0 1 0 39 36 1 22 26 • Pilot data: 4 subjects/group • Cisplatin + vinorelbin regimen
ANOVA 3 vs 4 P18_CHE_an34_244F_c2d_397.xls
Building of algorithme relies on 3 steps 9 Complet genome profiling of the Tumor (metastasis) as compared to the original histological normal tissue Tumor Normal Cancer is a clonal disease Cancer is a polygenic disease Drivers are mutations
10 Second step Identifiction of all genes altered by The drugs, or interacting with drugs Understanding of the interaction drug-gene ( genes of resistance, targets, genes of sensitisation,
11-01-10 Baseline 10-03-10 After 2 cycles
11-01-10 Baseline 10-03-10 After 2 cycles
11-01-10 Baseline 10-03-10 After 2 cycles
11-01-10 Baseline 10-03-10 After 2 cycles
2 Male Caucasian,58Y, 2003, NSCLC, cT4,N0,M1 • 9 therapeutic linesCisplatin Gemzar TaxotereNavelbineTaxolCarboplatinMediastinal RadiotherapyIRESSA AlimtaTarceva(HKI 272 (included in clinical trial) (pan Her Inhibitor)
4 START HKI272 Adrenal node (C2) = 26 mm
Adrenal node (C2) = 58 Disease Progression New sublclavious metastasis 7 21/11/08 : Progression Disease DECISION TO STOP HKI 272
2 • 9 therapeutic linesCisplatin (108)Gemzar (70)Taxotere (77)Navelbine (50)Taxol (82)Carboplatin (66)Mediastinal RadiotherapyIRESSA (66)Alimta (73)Tarceva(HKI 272 (included in clinical trial) (pan Her Inhibitor)
13 23/12/08 = • STOP HKI 272 • START Lapatinib +Xeloda + Thiothepa (introduced sequentially during 1 month)
16 01/02/10: Still on Lapatinib, Xeloda,Thiotepa Stable Disease !! Adrenal node (C2) = 62 mm
13 45 years Rhabdomyosarcoma 5 metastases