The tephigram
The tephigram. Allows a radiosonde profile to be analysed for stability Allows calculations involving moisture content (e.g. saturated adiabatic lapse rate) to be performed graphically Is very confusing at first sight!. Basic idea. Plot temperature as x-axis and entropy as y

The tephigram
E N D
Presentation Transcript
The tephigram • Allows a radiosonde profile to be analysed for stability • Allows calculations involving moisture content (e.g. saturated adiabatic lapse rate) to be performed graphically • Is very confusing at first sight!
Basic idea • Plot temperature as x-axis and entropy as y • dS = cpdlnθ so we plot temperature versus lnθ
Adding pressure Our measurements are of temperature and pressure, so we want to represent pressure on the plot. The curved lines are isopleths of constant pressure, in mb.
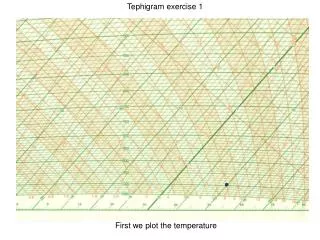
Rotating plot and plotting profile The diagram is rotated through 45° so that the pressure lines are quasi-horizontal Temperature and Dew point are plotted on the diagram. Dew point is simply plotted as a temperature. Here:
Adding Moisture information • Dew point is a measure of moisture content. The tephigram can be used to convert (TD,T) to mixing ratio • Mass mixing ratio isopleths are light dashed lines. Units are g kg-1 • Curved lines are saturated adiabats – the path a saturated parcel of air follows on adiabatic ascent
The Tephigram Saturated adiabatic ConstantMixing ratio
Example 1 Tropopause Inversion layer Saturated air (T = TD)
Example 2 Tropopause Frontal Inversion layer