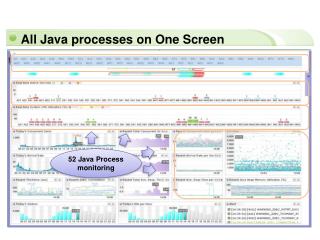
All Java processes on One Screen
All Java processes on One Screen. Dashboard. 52 Java Process monitoring. True- Real Time Data. Dashboard. Every 1 sec. Just finished. All symptoms of resource related performance problem is presented in increase in active service. JENNIFER updates active service count every 1 second.

All Java processes on One Screen
E N D
Presentation Transcript
All Java processes on One Screen Dashboard 52 JavaProcess monitoring
True- Real Time Data Dashboard Every 1 sec Just finished
All symptoms of resource related performance problem is presented in increase in active service. JENNIFER updates active service count every 1 second. User can see the detailed information of active services upon request even if the service is not yet finished. Active service monitoring Active Service Monitoring
Active Service Monitoring What services are queued? Just Click Instance Id Fetch Count Thread Id Service Call Time Service Name Response Time Status SQL Count Client IP
Active Service Monitoring Detail information for a active service ServiceName Click! Last exec SQL Active Stack Active Profile Client IP Select a transaction
Transaction Trace and X-View Profiling data is collected for individual transaction. Select a transaction requiring analysis to see its performance and profile. Performance and profile is displayed immediately after a transaction is finished. Profile not only shows method-level response time but also showCPU time, SQL text, parameters & execute time, FILE/SOCKET open, and TP-CALL. Transaction Trace & X-View
Transaction Trace & X-View Response Time Scatter Graph X-View High Response Time – Tune It! Error Transactions (red) Need Analysis Transaction Response Time Normal Transactions Transaction End Time
Transaction Trace & X-View X-View Patterns Waterfall Pattern Water drop Pattern Layered Cake Pattern Matrix Pattern
Transaction Trace & X-View Review Transaction Profile Click & Drag Click Focus-in on the abnormal transactions!
Transaction Trace & X-View Transaction Summary & Profile • Transaction Performance Summary • Service Name • Client IP • SQL Time, TX Time, Fetch Time, CPU Time • Response Time • JDBC Resource Usage • Connection Open / Close • Set Auto Commit / Commit / Rollback • Statement / PreparedStatement / CallableStatment Class • SQL and SQL Parameters • External Service Call(ex TP-CALL) • Method Response Time • Method Parameter/Return • File / Socket Open • New thread init • CPU Usage • Current thread Name • Customizable (with adapter)
JENNIFER Features Service Monitoring Powerful service naming (URL, Http Parameter, Method Name or Parameter/Return) TPS, Active Services, Hit per hour, Average response time, Client IP Peek Load Control Transaction Profiling and X-View Response time scatter graph(X-View) Transaction base profiling Dynamic profiling Dynamic stack trace User Monitoring Concurrent Users, Visit Users, Think Time JDBC & SQL Monitoring JDBC Connections, JDBC status, JDBC object leakage SQLs & SQL parameters Uncommit, rollback trace Resource Monitoring Memory, Heap Memory, File/Socket CPU, CPU core
Performance Statistics Daily resource usage Daily service performance Relation between Applications and DB Tables (CRUD Matrix) Relation between Applications and (SQLs or External services) Utilities Java Env, Retrieve loaded classes, Jar check Leakage Trace JDBC object leakage, Collection trace, Live object counting, Http session dump Integrations Multi JENNIFER server integration, manage by task or domain Extensions Non App Server, Remon(Shell,SQL,Class), Extra Agent, Profiling customization Alert 44+ Predefined Alert or Exception and customer alerts can be defined Reporting Daily, Weekly, Monthly performance and error statistic summary Other commonly used and user-defined template based reporting JENNIFER Feature cont…
JENNIFER’s Overhead Though many system experts agree that use of APM solution is necessary, they often denote excessive overhead as a major problem for its disuse. JENNIFER has been designed with overhead in mind~ According to survey that we conducted amongst our variable customers, JENNIFER’s overhead is estimated to about 3~5% average.
JENNIFER’s Overhead How does JENNIFER keep its overhead so low? Efficient use of data ports JENNIFER uses variety of UDP, TCP ports and data traffic efficiency algorithm to minimize the overhead. Dynamic Profiling Turn on/off profiling level right from the dashboard without restarting the application or server* Efficient data collection process Amount of data collected is the main culprit of overhead. Do not trade overhead for needless statistic data. JENNIFER collects just enough data to resolve all performance and establish SLA
Installing and deploying JENNIFER Many business may not realize their need for APM until its too late. JENNIFER is quickly installed and configured, thus providing immediate help with resolving customer’s application performance problem.
JENNIFER Structure JENNIFER is composed of three parts: JENNIFER Agent, JENNIFER Server, and JENNIFER Client. Java Application JENNIFER AGENT UDP Java Application Server JENNIFER SERVER Java VM JENNIFER CLIENT OS TCP TCP Java Plug-in WEB Browser JENNIFER INDEPENDENT AGENT UDP Java VM OS (JENNIFER Structure Diagram) 16
JENNIFER Server / Client Requirement JENNIFER requires following H/W and S/W specification for proper operation.
JENNIFER Agent Supported Platform JENNIFER supports most of the OS, JAVA (Sun, IBM, BEA, etc…) , and Java Application Server commonly found in current IT environments.
JENNIFER’s Paradigm Easy to deploy, lite on overhead. Service oriented approach to performance problem (Active Service, X-View). APM must be real-time, immediate recognition of problem, immediate analysis of root-cause.
Contact Information • US Location : 360 Fairview Way • Milpitas CA, 95035 • US Office Phone : +1-408-946-5508 Fax : +1-408-946-5509 • Sales Inquiry: sales@jennifersoft.com • Java Application Serveron Hong, Business Development Manager • Java Application Serveronh@jennifersoft.com • Partnership Inquiry: sales@jennifersoft.com • Java Application Serveron Hong: +1-408-464-8321 • Java Application Serveronh@jennifersoft.com • Andy Lee: +1-408-946=5508 • andy@jennifersoft.com