Download
1 / 47
470 likes | 595 Views
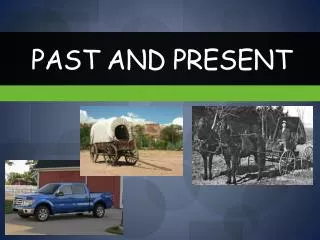
Indicators of Past and Present Climate. Ice Cores. “The Day After Tomorrow”, the beginning scenes are of scientists collecting ice core samples in Antarctica. At various locations in an ice core particulate matter can tell us about events like forest fires and volcanoes

E N D
Ice Cores • “The Day After Tomorrow”, the beginning scenes are of scientists collecting ice core samples in Antarctica. • At various locations in an ice core • particulate matter can tell us about events like forest fires and volcanoes • physical characteristics can tell us about temperature and humidity • trapped air tells us about greenhouse gas levels • composition tells us the temperature by analyzing the isotopes of oxygen that are present in the ice. • The only limit is how deep we can drill. The European Project for Ice Coring in Antarctica (EPICA) drilled 3270m to recover 800 000 years of history. Extra info: http://earthobservatory.nasa.gov/Features/Paleoclimatology_IceCores/
Ice Core Example An example of a product of ice core analysis is Figure 1 which shows how ice cores indicate a cycle of warming and cooling going back 400 000 years. Figure 1: Historical Temperature and Carbon Dioxide Levels (Dickinson, 2009, p.335)
Lake Cores • Sediments provide information on • Plant and animal communities at different points in history • Temperature, oxygen content and nutrient levels can be inferred based on plant, animal, diatoms (algae) • Rainfall and water level estimates Video: http://newscenter.berkeley.edu/2012/05/03/scientists-core-into-clear-lake-to-explore-past-climate-change/
Tree Rings • Trees grow one new ring each growing season (year) • The width of the ring provides information about how “good” the growing conditions were that year. • What do trees need to grow? http://www.priweb.org/globalchange/climatechange/studyingcc/scc_01.html
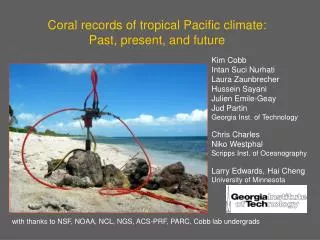
Other Past Climate Evidence • Coral Rings http://www.priweb.org/globalchange/climatechange/studyingcc/scc_02.html • Fossilshttp://newsroom.ucla.edu/portal/ucla/ancient-fossils-hold-clues-for-199756.aspx • Ocean Sediments http://apollo.lsc.vsc.edu/classes/met130/notes/chapter16/ocean_sed.html
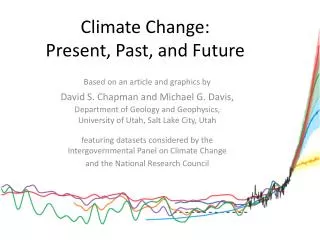
Rising Temperatures “Scientists have high confidence that global temperatures will continue to rise for decades to come, largely due to greenhouse gasses produced by human activities. The Intergovernmental Panel on Climate Change (IPCC), which includes more than 1,300 scientists from the United States and other countries, forecasts a temperature rise of 2.5 to 10 degrees Fahrenheit over the next century. According to the IPCC, the extent of climate change effects on individual regions will vary over time and with the ability of different societal and environmental systems to mitigate or adapt to change.” (http://climate.nasa.gov/effects) • Every degree matters – at the end of the last ice age global temperatures were less than 10degF cooler in the USA • As research continues, little consensus amongst scientists of exactly how much the temperature will rise and how quickly • Societal impacts? • Environmental impact? • Economic impacts?
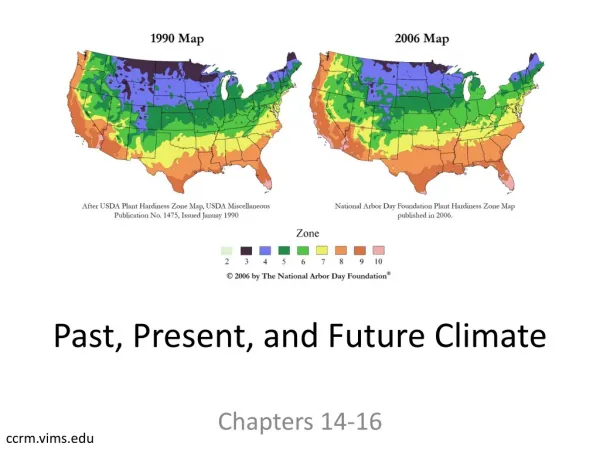
Rising Temperatures Average temperatures go up and down over the years but the general trend is INCREASING By 2006, 11 of the past 12 years were the warmest on record
In Canada, the average national temperatures have increased by 1oC in the last 55 yrs, they have risen 2.5oC in the Yukon
Coral Reefs • Coral is a key indicator of global ecosystem health. • Warmer air leads to warmer waters leads to coral bleaching (white, unhealthy corals) http://www.teachoceanscience.net/teaching_resources/education_modules/coral_reefs_and_climate_change/how_does_climate_change_affect_coral_reefs/
Melting Glaciers • Rising temperatures melt ice • Glaciers recede • Polar ice caps cleave and large chunks of ice break off • Environmental Impact? • Albedo • Animal habitats • Rising sea levels
Melting Glaciers Over the last few decades the average size of glaciers all over the world has begun to decrease as the temperature has increased People around the world depend on glaciers for their water – melting glaciers could lead to water shortages
Ice Sheets Ice sheets in Greenland are melting twice as fast as they did 15 yrs ago Snow is melting much further inland and at higher altitudes than ever before Sea Ice Summer ice continues to decrease
Loss of Land Ice • Only loss of land ice caps and glaciers contributes to rising sea levels
Rising Sea Level • As ice melts (ice caps, glaciers and sea ice) this turns into additional freshwater in our oceans • Two thirds of the global population lives within 80km from the sea coast. • Loss of land will be a major problem for coastal communities • Impacts for any areas at or near sea level elevation
Rising Sea Levels Global sea levels have risen significantly over the past 130 yrs Since 1993, sea levels has risen almost twice as fast than the 30 yrs before Can result in flooding of coastal areas Thermal Expansion: Warm water expands which also raises sea levels
Changes in Precipitation In the Northern hemisphere there is more precipitation as rain than as snow There has been an increase in heavy precipitation Other areas have received less precipitation than they used to and are experiencing periods of drought
Changing Seasons • Agricultural lands will change and growing locations will move • Societal impact – is it easy for humans to move? • Economic impact – direct affect to livelihood for many humans on this planet.
Changing Seasons Amount of snow that stays on the ground in winter is decreasing Amount of very cold days throughout the world have decreased Cold weather is starting later in the fall and ending earlier in the spring longer growing seasons
Changes in Ecosystems Trees, shrubs and flowers are flowering sooner due to temperature changes
Changes in Severe Weather • Severe weather includes most anything for which a warning is issued and definitely those situations where people’s safety is at risk.
Changing Precipitation • General changes in snow and rain • Have you noticed any changing patterns? • It snowed in Cairo this year.
Changes in Severe Weather Certain extreme weather events such as heat waves and hurricanes have become more severe i.e. Hurricane Katrina (2005) & Hurricane Sandy (2012)
Hurricane Katrina • The most economically devastating hurricane – $200 billion (2005)
El Niño, La Nina (1998-99) See: http://en.wikipedia.org/wiki/El_Ni%C3%B1o-Southern_Oscillation
Hurricanes in Brazil?? Occurred in 2002
Extreme Weather • There is no doubt that extreme weather events are becoming more frequent • Most powerful El Niño ever recorded (1997-98) • Most fatal hurricane (Mitch, 1998) • Hottest European Summer (2003) • The first South Atlantic hurricane ever recorded (2002) • Unprecedented flooding in Mumbai, India (2005) • The most Devastating hurricane season ($$) in the USA (Katrina, 2005) • Cyclone Monica – most powerful ever recorded (Australia, 2006)
Warming and Storms • The USA, (1996-1999) • 2x the storms • Warm water, warms air, holds more water • Every 10 degrees = double the amount of water (hurricane fuel = heat and water)
Homework • Complete the tree ring analysis at http://www.ecokids.ca/pub/eco_info/topics/climate/treerings/to learn about how tree rings give us information about past climates. [Thinking] • Choose one of the Other Past Climate Evidence items. Research and write a summary of how that item provides evidence of past climates. [Thinking] • Complete the Climatograph activity handed out in class.