Download
1 / 62
620 likes | 807 Views
Past, Present, and Future Climate. Chapters 14-16. ccrm.vims.edu. Redefining Climate. Climate is the long term behavior: Over a defined location For a defined time Of averages and extreme variables

E N D
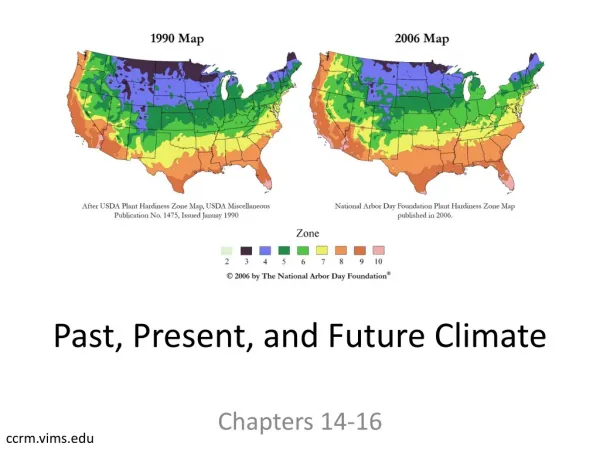
Past, Present, and Future Climate Chapters 14-16 ccrm.vims.edu
Redefining Climate • Climate is the long term behavior: • Over a defined location • For a defined time • Of averages and extreme variables • Climates usually remain the same over the course of a lifetime, but they have changed a lot over Earth’s lifetime.
Climate Controls • Several processes “control” climate they change or maintain it. • Latitude • Elevation • Topography • Water • Prevailing winds • Natural events (volcanic eruptions, earth’s orbit) • Human activities (building cities, burning fossil fuels)
Climate Classification • We use the KoppenScheme to define Climates:
Past Climate • Climate has changed since the beginning of Earth ~4 billions years ago • Humans have been around ~2 million years • We have only lived during a very small percentage • Good world-wide measurements only since 1970’s (satellite) • Good recorded temperature measurements world-wide since 1850’s • Written record dates to 484 BCE (Iron Age) – freeze dates, river heights, disease outbreaks • Oral tradition before that
Paleoclimatology • The study of climates of the distant past and the causes of their variations. • How do we investigate? • Ice cores, types of fossils, marine sediment, etc • Tells us amount of CO2 and O2 in the atmosphere • More recently • Tree rings (precipitation / temperature records) • Pollen sediments • Radiocarbon dating
Some Examples • Tree rings: Dendochronology • Tree’s ring width indicates how fast the tree grew during a particular time period. • Growth rate is a function of rain/temperature • Not only do we know how long the tree has been around, but we can also infer precip patterns • Varies by species (rain/temperature)
Some Examples • Isotopes: Radiocarbon Dating and Uranium. • Look at the ratio of isotopes (which have a specific half life). Based on the decay of the isotopes, we can date organic matter back 50K years (with 15% uncertainty) and rocks back to ~4.5 billion years (thanks to uranium). • Pollen: The types of sedimented pollen in lakes varies with which type of tree grew well that year in those conditions • Different trees = different climates = different temp/precip patterns • Ice cores: Air bubbles trapped in glaciers and ice sheets provide a record of the concentration of atmospheric gases.
Causes of Global Climate Change • Earth’s Orbit • Solar radiation changes • Tectonics • Volcanic activity • Asteroid impacts • Sea level falls • Changes in currents • Humans
Milankovitch Cycles • Precession: wobbling on the axis https://en.wikipedia.org/wiki/Precession#/media/File:Gyroscope_precession.gif • 27,000 years • Obliquity: Tilt of Earth • 41,000 years • Moves from 22 to 24.5 degrees • Eccentricity: Shape of orbit • 100,000 years • Perihelion can align with summer
Plate Tectonics • Definition: Modern theory of continental movement. Earth’s crust is broken up into plates that “float around” on the molten rock beneath. • The movement of these plates creates seismic and volcanic activity. • Over millions of years, these plates move to different latitudes, thus affecting climate.
Volcanic activity • Amount of particles released into stratosphere • Year without a summer: 1815 with the eruption of Tambora. • Resulted in global cooling and famine.
Asteroid Impacts Can cause cooling of global climate and wide spread extinctions.
Even more… • Variability in received solar radiation • Sunspot activity (or lack of Mauder Minimum) may have been responsible for the Little Ice Age from 1400-1850. • 11 year cycle as the sun flips its magnetic poles • Currently smallest cycle in 100 years! • Peak activity • More Northern Lights • Disruption of radio waves • Spots themselves are cool • Increased magnetic activity http://www.skyandtelescope.com/astronomy-news/the-weakest-solar-cycle-in-100-years/ http://www.spaceweather.com/
Even more… • Changes in ocean circulation patterns. • The melting/freezing of large ice sheets can disrupt the “normal” circulation patterns. • Ex: Disruption of Gulf Stream to Europe causes cooler temperatures over Europe
Changes in ice sheets • High albedo (reflective) • Limits the amount of incoming shortwave radiation that can be absorbed by the Earth • Keeps Earth cooler
Human (Anthropogenic) • Goes beyond the enhanced greenhouse effect (adding CO2 through the burning of fossil fuels). • Humans affect the climate in several ways: • Air pollution • Gases, aerosols, acid rain, CFCs • Changing Land Surfaces • Desertification, Urban Heat Islands • Global Warming
Air Pollution • Through many different processes (industry, transportation, etc) we release harmful gases and aerosols into the atmosphere. • Examples include • Carbon Monoxide (the incomplete burning of fossil fuels • Lead (treated gasoline…less of a problem now) • Oxides of sulfur Acid rain • Oxides of Nitrogen Smog • Hydrocarbons Smog
Air Pollution • We’ve made some improvements: • But we still have along way to go. Many of these gases (like smog) affect respiration, while CO can lead to less oxygen in your blood, and lead hurts brain function. • Pollutants can indirectly hurt climate…
Acid Rain • Sulfur Trioxide combines readily with water vapor to form droplets of sulfuric acid. • This creates acid rain • We measure the acidity of a substance based on the pH scale: • Pure water is neutral @ 7 • Below 7 is acidic • Above 7 is base • The pH of rain is typically ~ 5.5 (slightly acidic)
Acid Rain • The acidic rainwater will accumulate in lakes and streams. This hurts aquatic life. • It gets absorbed into the soil and may be hurting coniferous forests. http://environment.nationalgeographic.com/environment/global-warming/acid-rain-overview/
Changing Land Surfaces • The misuse of water for irrigation and other purposes has led to desertification – the spreading of a desert region due to climate and / or human influences. • Examples: • The Sahel (sub-Sahara) Region. Anomalous lack of rainfall (climate) and overgrazing (human) lead to desertification and famine • The Aral Sea in central Asia
Changing Land Surfaces • Urban Heat Island – the effect of temperatures within cities being warmer than the surrounding rural environments. • Increase of absorptive surfaces (asphalt, roofs, etc), heat from industrial activity, lack of transpiration from plants, all contribute to warmer city temperatures.
Airplane Contrails • Clouds that form from warm, humid exhaust mixes with the cold, dry air aloft • Can increase cloud cover if there is a large amount of air traffic • COULD cause lower daytime temperatures, warmer nighttime temperatures, highly debated, only one scientific study supports this and it was not statistically significant
Global Warming • Refers to the increase of temperature across the global due to the enhanced greenhouse effect. • The enhanced greenhouse effect is an above normal heating of the planet as a result of increases in atmospheric CO2 since Industrial Revolution • Two things we have to prove: • The Earth is warming • It’s warming because of more CO2
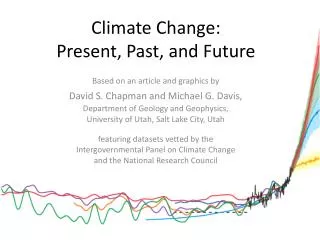
A Warming Earth – 1955-2005 • Years of scientific research have unequivocally shown the earth is warming at a faster rate than before.
A Warming Earth • The global average temperature increased 0.59° between 1955 and 2005, but warming has not been universal across the globe. • We see other evidence of increasing global temperatures: • Glacial Retreat • Reduction of ice and snow coverage • Rise in sea level (1.7 inch increase from 93-08) • Expanded growing seasons.
Sea level rise come from thermal expansion AND the melting of LAND ice. Sea ice already contributes to the height of sea level.
Carbon Dioxide Observations • Observations from multiple locations indicate that CO2 levels are increasing. • We base our knowledge of previous CO2 levels on the things we discussed previously (ice cores, etc). • We know we are contributing to the increase.
Burning of fuels/plants contributes more CO2 • Increased vegetation and algae decrease CO2
GCMs: Global Climate Models • We can also run computer models to predict future climates. • These models are similar to weather forecasting models, but they have much coarser resolutions and take into account other “spheres.” • These models are far from perfect, but can be used (in addition to observations) to predict future climates.
IPCC • Taking into account GCMs and observations , the IPCC (Intergovernmental Panel on Climate Change) has issued four reports since 1991 on climate change. • The have developed several different scenarios of future climates based on the amount of global warming and efforts to mitigate it.
Possible Effects • 20 to 30 % of all species have an elevated risk of extinction if global temps rise 1.5 to 2.5 C • 40 to 70% if global temps rise above 3.5 C • Meridional overturning circulation will slow down (troughs and ridges, less energy balance) • Extreme events will occur more readily
Possible Effects • However, GCMs have too coarse a resolution to “see” hurricanes. • Still much debate on the impact of a warmer earth on hurricane activity.