Download
1 / 50
500 likes | 635 Views
The Exposure - Effect Continuum: Emphasis on Biomonitoring. Larry L. Needham, Ph.D. Chief, Organic Analytical Toxicology Branch National Center for Environmental Health Centers for Disease Control and Prevention Atlanta, GA USA 30341. Inhalation. Ingestion. Dermal Contact.

E N D
The Exposure - Effect Continuum: Emphasis on Biomonitoring Larry L. Needham, Ph.D. Chief, Organic Analytical Toxicology Branch National Center for Environmental Health Centers for Disease Control and Prevention Atlanta, GA USA 30341
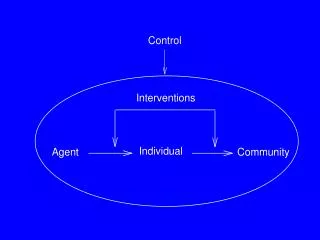
Inhalation Ingestion Dermal Contact Exposure-Effect Continuum for Environmental Chemicals Source Fate and Transport RISK MANAGEMENT Water, Air, Food, Soil, Dust, Sediment, Surfaces, Personal Care Products RISK ASSESSMENT Exposure Absorption following: Internal Dose Metabolism Distribution EPIDEMIOLOGICAL STUDIES Elimination Target Organ Dose Elimination Biologically Effective Dose Pharmacodynamic Processes Effect Angerer et al. Tox Sci 93(1) 3-10 (2006)
Inhalation Ingestion Dermal Contact Source (Chemical plant, waste site) Fate and Transport Water, Air, Food, Soil, Dust, Sediment, Surfaces, Personal Care Products Exposure (Contact) Absorption EXPOSURE EFFECT ANALYSIS EXPOSURE ANALYSIS Internal Dose Target Organ Dose Biologically Effective Dose Altered Structure/Function (“omics”) EFFECT ANALYSIS Effect Adapted from: NRC 1987
Biomonitoring Assessment of human exposure to an environmental chemical by measuring its exposure biomarker(s): the parent chemical (or its metabolite or reaction product) in human blood, urine, milk, saliva, adipose, or other tissue.
Biomonitoring for Disease Prevention R e s e a r c h P u b l i c H e a l t h A c t i o n s / P o l i c y R i s k A s s e s s m e n t R e f e r e n c e / A c c e p t a b l e D o s e s Health Effects / Risk Exposure Assessment Status & Trends Highly exposed Emerging chemicals Screening Susceptible populations BIOMONITORING Exposure pathway Clinical Studies Preclinical indicators Epidemiology Emergency Response Adapted from: HESI’s Biomonitoring Technical Committee
Biomonitoring for Disease Prevention R e s e a r c h P u b l i c H e a l t h A c t i o n s / P o l i c y R i s k A s s e s s m e n t R e f e r e n c e / A c c e p t a b l e D o s e s Health Effects / Risk Exposure Assessment Status & Trends Highly exposed Emerging chemicals Screening Susceptible populations BIOMONITORING Exposure pathway INTERPRETATION Clinical Studies Preclinical indicators Epidemiology Emergency Response Adapted from: HESI’s Biomonitoring Technical Committee
Biomonitoring Hinges on the Analytical Measurement • All numbers are not created equally • Accuracy • Precision • Specificity • Linearity & Range • Limit of detection • Ruggedness/Robustness • QA/QC Program • Interlaboratory comparison Needham et al. J Toxicol Environ Health A 65: 1893-1908 (2002)
Choosing the Appropriate Matrix • Chemical dependent • Population dependent (age, race, health status, etc.)
Selection of Biomonitoring Matrix: Environmental Chemical Dependent • Two primary classes of Environmental Chemicals • Persistent (half-lives in years); PCDDs, PCBs, PBDEs, PFCs, OCs, Pb • Non Persistent (half-lives in minutes/hours); phthalates, pesticides (OPs, carbamates, pyrethroids), VOCs
Absorption, Distribution, and Elimination of Environmental Chemicals in the Body Ingestion Inhalation Dermal Gastrointestinal Tract Primary Deposition Sites Lung Fat Bone Liver Blood/Lymph Portal Blood Secretory Structures Soft Tissues Bile Alveoli Kidney Tears Secretions Feces ExpiredAir Saliva Sweat Milk Urine Bladder Needham, Barr, and Calafat. Neurotoxicology 26:547-53 (2005)
Blood Toxicant/Metabolite Hemoglobin Adduct Concentration Albumin Adduct DNA Adduct Urinary Adduct Urinary Metabolite 1 10 100 1000 Time (Days) Post-Exposure Fate of a Persistent Chemical in Blood and Urine Needham and Sexton. JEAEE 10: 611-629 (2000) Adapted from: Henderson et al. Crit Rev Toxicol 20: 65-82 (1989)
Blood Toxicant/Metabolite Urinary Metabolite Albumin Adduct Concentration Hemoglobin Adduct DNA Adduct Urinary Adduct 1 10 100 1000 Time (Days) Post-Exposure Fate of a Nonpersistent Chemical in Blood and Urine If chemical forms an adduct: extends time window of exposure Needham and Sexton. JEAEE 10: 611-629 (2000) Adapted from: Henderson et al. Crit Rev Toxicol 20: 65-82 (1989)
Blood Toxicant/Metabolite Urinary Metabolite Concentration 1 10 100 1000 Time (Days) Post-Exposure Fate of a Nonpersistent Chemical in Blood and Urine Barr et al. Environ Health Perspect 113:1083-1091 (2005) Needham, Barr, and Calafat. Neurotoxicology 26:547-53 (2005)
Selection of Biomonitoring Matrix: Population DependentLife Stages of Children Death Young toddler 2 y Older toddler 1 y Infancy 3 y Birth Preschool Trimesters Embryonic (8d – 8w) 6 y Conception Pre High School 12 y 18-21 y Adolescence (High School) Needham et al. Environ Health Perspect 113:1076-1082 (2005)
Relative Importance of Various Biological Matrices for Measuring Exposure During the Different Life Stages Barr, Wang, and Needham. Environ Health Perspect 113:1083-91 (2005)
Exposure Assessment Approaches • Questionnaire/Historical Information (includes GIS + video) • Environmental monitoring (Air, Water, Food, Soil) • Biomonitoring • Combine these 3 approaches with calibrated and validated models
CDC’s Third National Report on Human Exposure to Environmental Chemicals(1999-2000) (2001-2002) www.cdc.gov/exposurereport
Caveats About the Report • The presence of a chemical does not imply disease • Cannot provide estimates for: • States, cities, special localities • Groups with special exposures • Analysis of trends for many chemicals awaits future data
NHANES • National Health and Nutrition Examination Survey (administered by NCHS) • Stratified, multistage, national probability sample of the civilian, noninstitutionalized population • Data released every 2 years • 30 localities via mobile trailers • Data collected • Extensive questionnaire on demographics and health behaviors • Physical exam • Medical and nutritional lab tests • Drinking water sampled
CDC’s National Report on Human Exposure to Environmental Chemicals Urine Specimens Ages 6 Blood Specimens Ages 12 Exceptions: Pb, Cd, Hg, cotinine 1 year 3 years +
Additional Chemicals in 3rd Report148 chemicals Exposure biomarkers for: • Metals • Polychlorinated biphenyls, dioxins and furans • Organochlorine pesticides • Carbamate pesticides • Organophosphorous pesticides • Pyrethroid pesticides • Herbicides • Polycyclic aromatic hydrocarbons • Phthalates • Phytoestrogens • Pest repellants • Cotinine • Perfluorinated chemicals • BFRs • VOCs • Perchlorate • Bisphenol A • Sunscreen agent • Triclosan • Acrylamide * Starting in ‘03 www.cdc.gov/exposurereport
National Exposure Report • Descriptive presentation • Geometric means, percentiles and confidence intervals • Demographic group comparisons • No health outcomes analysis • General text on: • Uses, sources, biologic fate, health effects • Comparisons to other biomonitoring studies
Lead • A chemical with “known” toxicity • Toxic effects define “Level of Concern”
Blood lead levels defining lead poisoning (g/dL) Human studies using blood lead as the measure of exposure have found health effects at lower and lower blood lead levels 70 60 50 40 30 20 10 0 1965 1970 1975 1980 1985 1990 1995
Lead used in gasoline declined from 1976 through 1980 110 100 90 80 Gasoline lead Lead used In gasoline (1000 tons) 70 60 50 40 30 1975 1976 1977 1978 1979 1980 1981 Year
Environmental modeling predicted only a slight decline in blood lead levels in people 110 17 Predicted blood lead 100 16 90 15 14 80 Lead used in Gasoline lead gasoline Mean blood 13 70 lead levels (thousands ( m g/dL) 12 of tons) 60 11 50 10 40 9 30 1975 1976 1977 1978 1979 1980 1981 Year
Lead in gasoline and lead in blood NHANES II, 1976-1980 110 17 Predicted blood lead 100 16 90 15 14 80 Gasoline lead Lead used In gasoline (1000 tons) 13 Blood lead levels (mg/dL) 70 12 60 11 50 Blood lead 10 40 9 30 1975 1976 1977 1978 1979 1980 1981 Year
After NHANES II, EPA further restricted leaded gasoline and gasoline lead levels continued to decline through 1991 18 100 16 14 80 12 60 Lead used In gasoline (1000 tons) Blood lead 10 Blood lead levels (mg/dL) Gasoline lead 40 8 6 20 4 0 2 1974 1976 1978 1980 1982 1984 1986 1988 1990 1992 Year
NHANES III (1988-1994) showed blood lead levels continued to decrease as gasoline levels declined 18 100 16 14 80 12 60 Blood lead Lead used In gasoline (1000 tons) 10 Blood lead levels (mg/dL) Gasoline lead 40 8 6 20 4 0 2 1974 1976 1978 1980 1982 1984 1986 1988 1990 1992 Year
Blood lead levels in the U.S. Children Ages 1-5 yrs, 1976 - 2002 16 14 12 10 Blood lead levels(mg/dL) 8 6 4 2 0 2000 2002 1976 1978 1980 1982 1984 1986 1988 1990 1992 1994 1996 1998 Year
Percentage of children 1-5 years old in the U.S. population with elevated blood lead levels ( 10 g/dL) 100 88.2 80 60 Percent 40 20 8.6 4.4 1.6 0 1976-1980 1988-1991 1991-1994 1999-2002
O N CH3 N Cotinine • Nicotine metabolite that tracks exposure to tobacco smoke • For nonsmokers, tracks exposure to secondhand smoke
5 4 3 2 1 0 0.1 1.0 10 100 1000 Exposure of the U.S. Population to Tobacco Smoke: Serum Cotinine Levels (NHANES III, 1988-1991) ETS exposure (nonsmokers) Smokers Percentage of the population Serum cotinine (ng/mL)
Environmental Tobacco Smoke • Monitored as serum cotinine • Comparing NHANES III (1988-91) to NHANES 99-02, median levels in non-smokers have fallen: • 68% in children • 69% in adolescents • About 75% in adults • Higher in non-Hispanic blacks than Mexican Americans or non-Hispanic whites
Serum Cotinine Levels: Tracking Exposure to Secondhand Smoke in the Non-smoking U.S. Population 1988-1991 1999-2002 0.3 0.2 68% 69% Serum cotinine(ng/mL) 75% 0.1 0 4-11 12-19 20-74 Age (years)
Effect Based on human studies or animal studies Internal Dose Based on human studies and animal studies Exposure Water, Air, Food, Soil, Dust, Sediment Working Backwards on Pathway: Example Dioxin * * ~ 95% of exposure via food chain; mitigation: regulate levels in food
Question • Two examples (lead and cotinine) “levels of concern” are based on “known” human toxicity. • Should we have similar or different “levels of concern” for other chemicals, for which we have limited toxicity data, but base these “concern levels” on biomonitoring data? AK Department of Health is basing fishing advisories on biomonitoring data (Arnold et al. AJPH 95 393-7 (2005))
NHANES Serum Pools • 2001-2002: 12 years of age and older 3 - 5 years: planned 6 - 11 years: planned
Serum Pools: NHANES 2001/2002 • Used for estimates of the “means” • 34 People per pool (Total 1,734 people; 51 pools) • 0.75mL Serum per person • 25.5 g Serum per pool • 2 g BFRs/PCBs/Persistent Pesticides • 22 g PCDDs/PCDFs/cPCBs • 0.5 g Total Lipids • 0.4 g Perfluorinated chemicals
NHANES 2001-2002 Pools ( ) for perfluorinated chemicals
Geometric Mean & 95% Adjusted CI of TEQs (PCDDs, PCDFs, dioxin-like PCBs) by Age, Group, Race & Sex (using 2005 TEFs)
What is a Flame Retardant? • Flame Retardants (FRs) are a diverse group of chemicals that are added to materials such as plastics, rubber, textiles and construction materials to reduce their flammability. • Annual World production of FRs estimated to 600,000 metric tons • 25% of world production of FRs were bromine containing chemicals • 5-30% of flame retarded polymeric materials consist of FRs • Inorganic compounds often used in combination with brominated and/or phosphorus containing FRs.
Perfluorochemicals (PFCs) in the Environment • Produced since 1950's for use in: • Surface treatments: soil and stain resistant coatings on textiles, carpet, leather • Paper protection: provides oil, grease and water resistance on paper products including those for food use • Performance chemicals including insecticide, fire fighting foams, industrial surfactants, acid mist suppression • 3M phased out its fluorooctanylchemistry in May 2000
Biomonitoring for Disease Prevention R e s e a r c h P u b l i c H e a l t h A c t i o n s / P o l i c y R i s k A s s e s s m e n t R e f e r e n c e / A c c e p t a b l e D o s e s Health Effects / Risk Exposure Assessment Status & Trends Highly exposed Emerging chemicals Screening Susceptible populations BIOMONITORING Exposure pathway Clinical Studies Preclinical indicators Epidemiology Emergency Response Adapted from: HESI’s Biomonitoring Technical Committee
Exposure Analysis for Disease Prevention R e s e a r c h P u b l i c H e a l t h A c t i o n s / P o l i c y R i s k A s s e s s m e n t R e f e r e n c e / A c c e p t a b l e D o s e s Health Effects / Risk Exposure Assessment Status & Trends Highly exposed Emerging chemicals Screening Exposure Analysis Susceptible populations Exposure pathway Clinical Studies Preclinical indicators Epidemiology Emergency Response Adapted from: HESI’s Biomonitoring Technical Committee