Download
1 / 38
380 likes | 481 Views
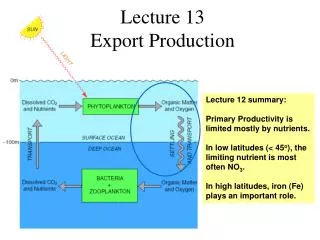
Or Export of Secondary Production in Ecosystems. Ecosystem Subsidy Examples. Salmon returning from the sea Migrations of birds and large mammals River movement of detritus * But very few studies have attempted to quantify the impact of the subsidy in the recipient ecosystem. .

E N D
Or Export of Secondary Production in Ecosystems
Ecosystem Subsidy Examples Salmon returning from the sea Migrations of birds and large mammals River movement of detritus *But very few studies have attempted to quantify the impact of the subsidy in the recipient ecosystem.
BECAUSE MOST OF THE PRODUCTIVITY AND ENERGY IS IN PLANTS & VERY LITTLE IS IN ANIMALS, ANIMALS CAN’T BE IMPORTANT IN STRUCTURING ECOSYSTEMS. RIGHT?
TWO ROLES OF ANIMALS Transformation Translocation Kitchell et al. 1979 BioScience 29: 28 -34
WHY MIGHT TRANSLOCATION BE CONSUMERS IMPORTANT? • Mobility and behavior of animals can cause substantial and rapid redistribution of nutrients. • They can readily cross physical mixing boundaries, such as temperature or salinity stratification. • They often make migrations that cross ecosystem boundaries. • They are TASTY bits that enter foodwebs
MENHADEN ECOSYSTEM BOUNDARY JUVENILE LARVAE EGGS ADULT ESTUARY 0-age year class 1, 2, 3 age year class OCEAN
MASS BALANCE The mass of how many larvae entering the estuary equals the mass of one juvenile leaving the estuary? Entering Leaving
NET EXPORT IS A FUNCTION OF: GROWTH RATE Increase in size of individual TIME MORTALITY RATE How many are there? TIMING OF MIGRATION When do they cross the ecosystem boundary compared to growth and mortality? TIME (OR SIZE)
GROWTH AND TIMING LEAVING ENTERING
MASS BALANCE / Breakeven # = ( ) x (% NJ) ( ) x (% NJ) Break even number is the number of larvae entering that exactly balance one juvenile leaving = Net flux of zero Net Flux = exit-enter (# juv. exit) x (mass one juv. )*(ConcJuv) - (# larvae enter) x (mass one larvae)*(ConcLarvae) Net Flux = Zero 0 = (1 juvenile) x (mass)*(CJ) - (? larvae) x (mass)*(CL) ? Larvae = (1 juvenile) x (mass)x (CJ) / (mass)*(CL)
LEAVING ENTERING
An Ecosystem Subsidy Big Bend Seagrass 3000 km2 of seagrass High primary production Exports: Lots and Lots of Pinfish Leave and most do not return Seagrass Offshore Reefs Northeastern Gulf of Mexico Lower primary production High fishery yields
The Hypothesis • The fall egress of seagrassdwelling fishes to offshore reefs constitutes a major food source for reef communities. • This migration contributes directly the reproductive productivity of spring spawning groupers.
SEAGRASS Shallow/Deep Reefs GAG
13C 25 % (S.E. 0.63) • 34S 18.5 % (S.E. 0.01)
Benthic Feeders Piscivores
Conclusions • Seagrass habitat derived organic matter reaches shallow water reefs and is consumed by resident species and gag grouper 2. Flux by fin provides ~20 % of the biomass on shallow water reefs and in gag muscle tissue. 3. Gag are likely making a pre-spawning migration to shallow water to feed intensively on the seagrass species.
Does Fin Flux Stack Up Nitrogen is the limiting nutrient in the Gulf of Mexico. This fish flux could represent a large movement of nitrogen to the Gulf. Lucky for me Chris Stallings of the FSUMCL decided to figure out how many fish are in the Big Bend. Each year 1.5 Billion pinfish leave the seagrass beds of the Big Bend By using a length weight curve we can estimate the total amount of organic nitrogen contained in the pinfish flux. Pinfish Abundance
2009 2010
Major Nitrogen sources Apalachicola River Atmosphere Trichodesmium
Nitrogen Sources Big Bend Pinfish 6.5*108 N yr-1 Atmospheric Deposition 5.4*1010g N yr-1 Apalachicola River 1.7*1010 g N yr-1 Trophic steps required to become available to gag 3-4 3-4 0 Tropic transfer efficiency of Nitrogen = 0.28 Apalachicola River 1.3*109–3.8*108 g N yr-1 Big Bend Pinfish 6.5*108 N yr-1 Atmospheric Deposition 1.2*109-3.3*108g N yr-1 Based on our estimates a single species of fish (Pinfish) flux ~14-36 % of the total nitrogen available to grouper annually in the N.E. Gulf of Mexico. Since the pinfish flux is directly available as a prey item and is not lost to bacterial respiration or sedimentation we hypothesize that this flux contributes significantly to the high fishery yields in the area.
Nitrogen Sources Big Bend Pinfish 6.5*108 N yr-1 Atmospheric Deposition 5.4*1010g N yr-1 Apalachicola River 1.7*1010 g N yr-1 Trophic steps required to become available to gag 3-4 3-4 0 Tropic transfer efficiency of Nitrogen = 0.28 Apalachicola River 1.3*109–3.8*108 g N yr-1 Big Bend Pinfish 6.5*108 N yr-1 Atmospheric Deposition 1.2*109-3.3*108g N yr-1 Based on our estimates a single species of fish (Pinfish) flux ~14-36 % of the total nitrogen available to grouper annually in the N.E. Gulf of Mexico. Since the pinfish flux is directly available as a prey item and is not lost to bacterial respiration or sedimentation we hypothesize that this flux contributes significantly to the high fishery yields in the area.
So what does it all Mean In our system seagrass habitat and the productive inshore environment provide a significant source of organic matter to the offshore environment via the movement of fishes. This link is critical to the reproduction of a highly valuable fisheries species in the northern Gulf. These fishes also carry organic toxins such as MeHg and thus provide a link between near shore pollution and contamination of food fishes (e.g. grouper and tuna). Globally this phenomenon is likely very common in temperate coast regions where season changes in temperature make near shore waters too cold to inhabit. Stable isotopes provide a powerful tool than can be used to quantify the impacts of ecosystem subsidies.
The TIDE project Trophic cascades and Interacting control processes in a Detritus-based aquatic Ecosystem The TIDE project is a National Science Foundation Integrated Research Challenges in Environmental Biology (IRC-EB) funded study investigating the long-term fate of coastal marshes in the Plum Island watershed. Specifically this project will look at the interactive effects of nutrient enrichment and the removal of top level consumers in several small tidal creeks of the Rowley river.
Consequences in Ecosystems Johnson & Short 2012
Pair-wise Regression R2=0.99, p= 0.004
Trophic Bottleneck Observed an increase (4x) in the abundance of inedible long lived snails in fertilized creek. Mummichog experience high mortality over the winter. Increased direct or indirect competition for food between the long lived snail and the short lived mummichog.
Conclusions Eutrophication initially increased production of mummichog but some tipping point was reached and now production is decreasing Possible mechanisms are habitat degradation or a trophic bottleneck. We are working to examine these new questions. Mummichog may provide an important trophic subsidy to striped bass.