1 / 1

Durham et al Online supplement Figure 1.

40 35 30 25 20 15. standards no template control. A. B. 200 160 120 80 40 0 -40. Threshold Cycle. R 2 = 0.999 PCR Efficiency = 98.2% y = -3.367x + 38.019. Base line subtracted RFU.

faraji
Download Presentation

Durham et al Online supplement Figure 1.

An Image/Link below is provided (as is) to download presentation Download Policy: Content on the Website is provided to you AS IS for your information and personal use and may not be sold / licensed / shared on other websites without getting consent from its author. Content is provided to you AS IS for your information and personal use only. Download presentation by click this link. While downloading, if for some reason you are not able to download a presentation, the publisher may have deleted the file from their server. During download, if you can't get a presentation, the file might be deleted by the publisher.

E N D

Presentation Transcript


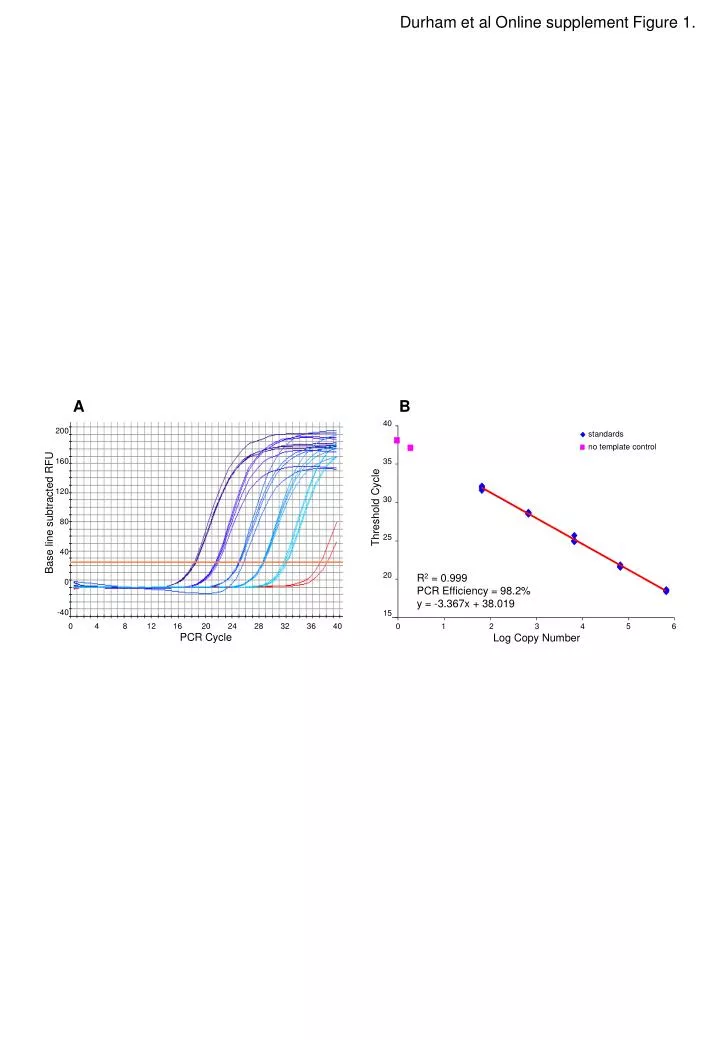
  1. 40 35 30 25 20 15 standards no template control A B 200 160 120 80 40 0 -40 Threshold Cycle R2 = 0.999 PCR Efficiency = 98.2% y = -3.367x + 38.019 Base line subtracted RFU 0 1 2 3 4 5 6 Log Copy Number 0 4 8 12 16 20 24 28 32 36 40 PCR Cycle Durham et al Online supplement Figure 1.

More Related