Download
1 / 31
310 likes | 329 Views
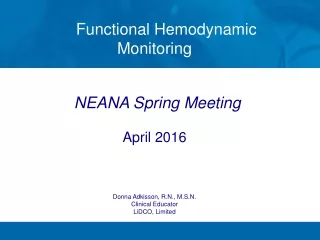
Functional Hemodynamic Monitoring NEANA Spring Meeting April 2016

E N D
Functional Hemodynamic Monitoring NEANA Spring Meeting April 2016 Donna Adkisson, R.N., M.S.N. Clinical Educator LiDCO, Limited
Functional Hemodynamic Monitoring Objectives Describe the physiology of heart lung interactions that cause hemodynamic changes throughout respiration. List 3 parameters used to predict patient response to volume. Explain normal parameters and intraoperative application of functional hemodynamic monitoring Define afterload and contractility of the heart.
Anatomy & Physiology Review Blood Flow in the Heart • From the body • Right side of the Heart • To the lungs for Oxygenation • Air in via trachea • Bronchus • Bronchioles • Alveoli • Capillaries • Oxygen in • Carbon Dioxide out • Left side of the Heart • Out the aorta
Anatomy & Physiology Review Cardiac Cycle Diastole – relaxation or filling • Preload coming into right side of the heart • 70% of blood flows into the ventricles passively • Other 30% from atrial kick Systole – contraction or pumping • Atrial Systole = Ventricular Diastole • 30% of blood flows into the ventricles from the atrial contraction • Ventricular Systole • How well can the heart pump – Ejection or Stroke Volume • What is the heart pumping against - SVR
Cardiac Output • CO = SV x HR • Cardiac output is the volume of blood pumped by the heart per minute. For an average size of adult (70 kg) at rest this would be about 5 liters/min. During severe exercise it can increase to over 30 liters/min. • Cardiac output is frequently necessary to assess the state of a patient's circulation. The simplest measurements, such as heart rate and blood pressure, may be adequate for many patients, but if there is a cardiovascular abnormality then more detailed measurements are needed.
Cardiac Output • Ways to clinically determine Cardiac Output: • Dilution method • Thermodilution • Green Dye • Lithium Dilution • Arterial Wave Form Analysis • Blood sample to calculate the Fick equation • Continuous Cardiac Output • TEE/EsopheagealDoppler
Beat-to-Beat Continuous Cardiac Output Pulse Power waveform analysis continuously assesses the patient's hemodynamic status by analyzing and processing the arterial pressure signal obtained from the primary blood pressure monitor. www.lidco.com
CO = SV x HR Stroke Volume The volume of blood from the LV per beat/cycle of the heart Effected by: Amount of Blood coming into the heart – Preload How well the heart works – Contractility How much pressure or resistance the heart has to work against - Afterload
Functional Hemodynamic Monitoring Q: What do you expect to happen to the below during induction in some if not most of your cases? Stroke Volume Heart Rate Cardiac Output Systemic Vascular Resistance Mean Arterial Pressure
Functional Hemodynamic Monitoring Cardiac Output - decreases Systemic Vascular Resistance - little change Mean Arterial Pressure – decreases Stoke Volume - decreases Heart Rate - increases
Ventricular Preload and Fluid Responsiveness • Fluid Resuscitation is not without risk • Less than 50% of patients respond to a fluid bolus. • The heart performs more efficiently when appropriately filled. • The term preload refers to maximum stretch on the heart's muscle fibers at the end of diastolic filling. The degree of stretch is determined by the volume of blood contained in the ventricle at that time. • Fluid Resuscitation is the primary treatment of many shock states
Ventricular Preload and Fluid Responsiveness Functional Hemodynamic Indices are predictors of fluid responsiveness • Reflect the effect of positive pressure ventilation on preload and SV • Pulse Pressure Variation • Stroke Volume Variation • Systolic Pressure Variation Commonly used static preload measurement are not sensitive or specific predictors of a patient's ability to respond to fluid bolus • CVP • PAOP
Best Preload Responsiveness - PPV Michard et al (1999) found PPV gave a more accurate measure of fluid responsiveness when compared to SPV, which it turn was a better measure than CVP and PAOP. Michard F., Boussat S, Chemla D, et al. Relation between respiratory changes in arterial pulse pressure and fluid responsiveness in septic patients with acute circulatory failure. American Journal of Respiratory and Critical Care Medicine. Jul 2000;162(1):134-138
PPV, SVV & PLR • The main limitations to the use of dynamic parameters in patients have been summarized as ‘SOS’. • The first ‘S’ stands for: Small tidal volume or Spontaneous breathing activity. The ‘O’ stands for Open chest and the last ‘S’ stands for: not in Sinus rhythm. • PLR – Passive Leg Raise (when appropriate) can be used when PPV or SVV can not. PLR is reversible and equated to a positive Fluid Challenge when observing an increase of 10%+ in Stroke Volume during the maneuver.
Hemodynamic Monitoring • Arterial Waveform Analysis • Preload indicator - looks at the variation from inspiration to expiration of the patient • PPV - Pulse Pressure Variation • Greater than 13% patient preload responsive • SVV - Stroke Volume Variation • Greater than 10% patient preload responsive • SPV - Systolic Pressure Variation • Greater than 5mmHg patient preload responsive
Frank Starling’s Law • The greater the ventricle is filled during diastole, the more the muscle fibres are stretched, the greater is the force of contraction. • This is true to a defined point of stretch above which point contraction force will not increase further.
Patient A is preload responsive On steep part of curve Set preload results in Significant increase in SV Patient B is not preload responsive An equal preloading does not result in a great increase in SV This patient does not require fluid resuscitation Frank Starling Curve Patient B SV SV Preload Patient A SV Preload
Functional Hemodynamic Monitoring What do you expect to happen during long surgical case where there is significant blood loss
Afterload Systemic Vascular Resistance • The amount of pressure the heart must work against • Decreases as CO & CI increases • Can be controlled with medications • Vasoconstrictor–Increases SVR & BP • Vasodialators–Decreases SVR & BP
Functional Hemodynamic Monitoring What do you expect to happen during surgical cases when the patient is Hypo or hypertensive – using fluids and vasoactive drugs to control the blood pressure
Contractility Muscle Compliance (EF) • The ability of the muscle fiber to stretch and contract Myocardial Contractility • Is the power of contraction • Is independent of preload or afterload • At a constant preload • positive inotropic agents > contractility > SV
Functional Hemodynamic Monitoring What do you expect to happen during surgical cases where the surgeon wants the patient dry?
CO = SV x HR Heart Rate HR < 60 beats per minute HR > 100 beats per minute • Bradycardia – pacemaker, Atropine, Epinephrine • Tachycardia – Cardioversion, Digoxin, Treat fever or shock causing ↑ HR
Functional Hemodynamic Monitoring Positioning and Procedural factors can also have a major impact on flow. Think About The impact of flow during a severe Trendelenburg position in a long robotic procedure Insuflationduring a Laproscopic procedure.
Cardiac Output Changes Cardiac Output Increases • Vasodilation • Decrease in SVR • Increase in Contractility • Increase SV • Increase in Heart Rate • Tachycardiac Cardiac Output Decreases • Decrease in blood volume • Increase in PPV or SVV • Decrease in ejection fraction • Decrease in SV • Decrease in Heart Rate • Bradycardia
Question? • Which indicator is the most sensitive and specific for preload responsiveness? • Central Venous Pressure (CVP) • Pulse Pressure Variation (PPV) • Pulmonary Artery Occlusion Pressure (PAOP)
Question? • An 86 year old woman for exploratory lap has a Cardiac Output of 3.6, Cardiac Index of 1.8, SVR of 1530, Stroke Volume of 45, BP 74/56, pulse 64 and Pulse Pressure Variation of 36%. • What should you do? • Give 250ml of IV fluid • Give Levophed IV • Continue to monitor her vital signs
A 65 year old man pacemaker insertion. Cardiac Output is 5.6, Cardiac Index is 2.7, SVR is 783, Stroke Volume is 77 BP 98/64, pulse 72 and Stroke Volume Variation is 12%. What should you do? • Continue to monitor • Give 250ml IV Fluid • Start an Vasoconstrictor Question?
Functional Hemodynamic Monitoring Hemodynamic monitoring has traditionally involved the placement of a pulmonary artery catheter Minimally invasive/non-invasive Cardiac Output Monitoring eliminates the complications of the pulmonary artery catheter Which includes: Complications Related to Catheter Vascular Complications
NEANA . Thank You for the invitation!