Download
1 / 11
110 likes | 182 Views
Learn how to analyze scatter plots, calculate slopes, and determine correlations between data points to draw lines of best fit. Practice writing equations and making predictions based on the data.

E N D
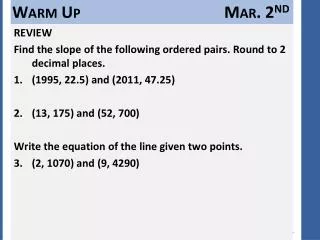
REVIEW • Find the slope of the following ordered pairs. Round to 2 decimal places. • (1995, 22.5) and (2011, 47.25) • (13, 175) and (52, 700) • Write the equation of the line given two points. • (2, 1070) and (9, 4290) Warm Up Mar. 2nd
Definition: A scatter plot is a graph of ordered pairs. • They may not form a straight line, but we can look for a pattern (correlation). • 3 Types of Correlation: 5.7 Scatter Plots and Lines of Best Fit
Determine whether each graph shows a positive, negative or no correlation. If there is a positive or negative correlation, describe its meaning in the situation. • 1. Correlation: • __________________ • Meaning: _____________ • __________________ • __________________ • __________________ Analyze Scatter Plots
2. 3. Analyze Scatter Plots (cont.)
Definition: A line of best fit is a line that describes the trend of the data. • It tries to split the points down the middle. Also referred to as the “best-fit line”. • Examples: Write the equation for the line of best fit. • 1. Line of Best Fit
Draw a scatter plot and determine what relationship exists for the data. • Write the slope-intercept • form of an equation for • the line of best fit. Line of Best Fit (cont.)
Use the table that shows the average body temperature in Celsius of 9 insects at a given air temperature. • Write the slope-intercept form of an equation for the line of best fit. You Try!
Examples: • Using the equation of the line of fit for the Bald Eagle data, estimate the number of bald eagle pairs in 1998. Using the Line of Best Fit & Predictions
Using the equation of the line of fit for the temperature data, predict the air temperature if an insect has a body temperature of 40 degrees. Examples (cont.)
The table gives the number of carbon atoms and the boiling points for several hydrocarbons. • Write the slope-intercept • form of the line of best fit. • 2. Predict the boiling point for • Methane (CH4) which has 1 • carbon atom. • 3. The boiling point of heptane is 98.4 degrees. Predict the number of carbon atoms in heptane. You Try!
5.7 Worksheet Homework