Download
1 / 35
350 likes | 480 Views
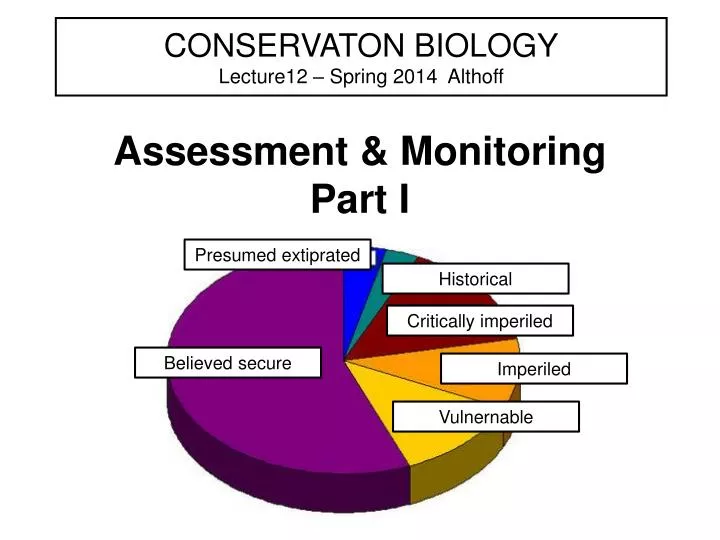
CONSERVATON BIOLOGY Lecture12 – Spring 2014 Althoff. Assessment & Monitoring Part I. Presumed extiprated. Historical. Critically imperiled. Believed secure. Imperiled. Vulnernable. Assessment. What is there?

E N D
CONSERVATON BIOLOGYLecture12 – Spring 2014 Althoff Assessment & Monitoring Part I Presumed extiprated Historical Critically imperiled Believed secure Imperiled Vulnernable
Assessment • What is there? • What is there at the a) genetic level ? b) species level ? c) ecosystem level ? • How good are we at making these assessments, how quickly can we make them?
Monitoring • Can we keep track of what is there? • Can we keep track of the diversity at all levels a) genetic level ? b) species level ? c) ecosystem level ? • How good are we at monitoring, how costly is it to monitor?
Assessment Monitoring Management decisions
What do we need to assess?consider at the species level • Who is there? • What is their status there among those who are at-risk? near extinction (i.e., endangered) threatened species of concern regionally, a species of concern
Plethora of terms…. • near extinction= endangered = critically imperiled • threatened = imperiled = ? • at risk = vulnerable = ? • etc.
Who is keeping track (as in assessing and monitoring)? • State agencies • Federal agencies • NGO’s (local, regional, national, international
State Agencies • For many states, this ‘resides’ in the Natural Resources department/division. • Other states have ______________________ database Natural Heritage Network database For Ohio, the NHP is based in the ________________________________
Federal Agencies • Generally, think __________________________ (in the Department of Interior) • But other agencies get involved: US Forest Service US Geological Survey (USGS) APHIS National Parks Service (NPS) etc.
NGOs • Think..….Nature Conservancy and • Nature Serve
Started first state natural heritage programs in ____ Established in _____
NatureServe • Association for Biodiversity Information was original name • Today: basically _________________ coverage • Today: ___ “independent” natural heritage programs feed into its network • Today: ________ scientists • Today: ______ million budget • http://www.natureserve.org/
NatureServe Status Global Status: G3G4 Global Status Last Reviewed: 25May2007Global Status Last Changed: 04Oct2001Rounded Global Status: G3 - Vulnerable Reasons: Widely but patchily distributed in the Appalachian Mountains region; subpopulations that are isolated or disjunct or at the periphery of the range tend to be threatened or declining; better information on status is needed for many areas; narrow habitat requirements; threatened by habitat loss.Nation: United States National Status: N3N4 Green Salamander
Assessing Quality & Threats:Nature Conservancy AQUATIC example • EPA Index of Watershed Indicators (IWI) • Hydrologic Alternations (dams, water use, channelization, drains, stream diversions, land use, wetland loss) • Sedimentation (soil erosion maps, other NRSC resources) • Water Quality (nutrient and pesticide loading, mines) • Biological Alteration (invasive species, vulnerable species, fisheries management activities, etc.) • Spatial Data
Conservation by DesignNature Conservancy Approach • Assessment of ______________________ • Break it down further by __________________ • Develop a _________________________ based on the biota of the region
Temperate Grasslands Major habitat type
Great Plains/ Flint Hills regions (tall grass prairie) Ecoregions
MetricsWhat do we measure and how? _____________________ • SpeciesRichness • Diversity Indices (Simpson’s, Shannon-Wiener, evenness, etc.) • Presence/Absence Abundance or Relative Abundance _____________________
Relative RelativeAccuracy Costs Presence/Absence Checklist Survey Occupancy Estimation Abundance (relative abundance)
Checklist • ________ technique in the book! • As conservation biologist become more sophisticated with “statistical” approaches, checklist were pretty much dropped as having value: a) considered anecdotal b) lacked quantitative content • But…many still keep field notes and amateur groups routinely keep records of sightings (especially birders)
Checklist…advantages • _____ cost • ___________________ to compile assuming: a) accurate ID of species b) accurate recording of species, location, etc. • _______________…many areas searched that may not get covered with formal, “scientifically sound” sampling • _______________ with carrying on other activities including hiking, birding, patrols, etc.
Checklist… some biases/disadvantages • Hot spots likely to receive _______ attention that places that individuals suspect does not offer much in the way of viewing wildlife • “_________” species more likely to be detected during routine observations than those that are not as colorful, nor perceived as “exciting” • My hit “peaks” of activity…____ full range of activity • _________ observations (i.e, droppings, nests, tracks, etc.) often not recorded
Checklist can provide… • Long-term data sets • Population trends (coarse) • Species richness estimates as well • Biogeographic patterns Given the _____________________________ __________________, this approach should be considered as another “piece” to the monitoring effort.
Presence/Absence • Obtaining population demographic data is often extremely costly…and impractical for a large number of species. • Recent research into presence/absence surveys indicates thatthis approach may serve as a more cost-effective way to monitoring some species • Additional research is needed…. • But, in simplest form, _________________ (survey) per timeframe (= year?)
Occupancy Estimation—some basics • Single time, once-a-year surveys are of _________ value if no pilot study conducted to determine _____________________ • The ______ surveys that are done in a “reasonable” time frame, the greater the _______________ in a determination of “presence” or “absence” • _________________ are required….example Site 1: 0 1 0 1 1 Site 2: 1 0 0 0 0 Site 3: 0 0 0 0 0 Site 4: 0 0 0 1 0 Site 5: 0 0 1 1 0 Survey No. 1 2 3 4 5
Occupancy Estimation:conducting enough surveys toobtain detection probabilities Site 1: 0 1 0 1 1 Site 2: 1 0 0 0 0 Site 3: 0 0 0 0 0 Site 4: 0 0 0 1 0 Site 5: 0 0 1 1 0 Survey No. 1 2 3 4 5
Presence/Absence 2 surveys to detect 1 survey to detect Site 1: 0 1 0 1 1 Site 2: 1 0 0 0 0 Site 3: 0 0 0 0 0 Site 4: 0 0 0 1 0 Site 5: 0 0 1 1 0 5 surveys, not detected…”absent” 4 surveys to detect 3 surveys to detect Survey No. 1 2 3 4 5
At what point do you have the most confidence in your data to conclude that the species is present or absent from the area? • ____________ the species is to ‘see’ the few surveys you would need • The better the _______________________ , the fewer the surveys you would need • The ____________________________________, ______________ the more likely you are to improve the confidence in the probability of detection
Some key references… Ruggerio, L. and D. Pearson. 2000. Presence/absence as a metric for monitoring vertebrate populations. USDA Forest Service Proceedings RMRS- P-17. Pages 41-44. Royle, J.A. and J. D. Nichols. 2003. Estimating abundance from repeated presence- absence data or point counts. Ecology 84(3):777-790. • Occupancy estimation surveys and determination of probability of detection will… a) b) c) MacKenzie, D.I., J.D. Nichols, J.A. Royle, K.H. Pollock, L.L. Bailey, and J.E. Hines. 2006. Occupancy estimation and modeling: inferring patterns and dynamics of species occurrence. Elsevier Academic Press, New York, New York.
Assessment & Monitoring: STREAMS & WADEABLE RIVERS • _____ = Rapid Bioassessment Protocols • Use in streams • Assess periphyton, benthic macroinvertebrates, and fish • Follows “technical” framework of the IBI, which is the ______________________first proposed by Karr (1981) for fish assemblages. • IBI incorporates a) zoogeographic, ecoystem, community, and popn aspects
RBI Barbour, M.T., J. Gerritsen, B.D. Snyder, and J.B. Stribling. 1999. Rapid Bioassessment Protocols of Use in Streams and Wadeable Rivers: Periphyton, Benthic Macroinvertebrates and Fish. Second edition. EPA 841-B-99-002. U.S. Environmental Protection Agency, Office of Water, Washington, D.C. • Focus on Fish – see handout – Chapter 8 a) “representative” stream reach (away from major influences tributaries, bridge/road crossing…to not affect overall habitat) b) collection via electrofishing c) start at downstream barrier, minimum 2- person crew d) collect all fish >20 mm in total length, ID e) overall health noted for collected specimens
RBI…con’t • Species Composition and Composition Metrics (see Table 8-1) Metric 1: Total number of ____________ Metric 2: Number and identity of _________ species Metric 3: Number and identity of _________ speciesMetric 4: Number and identity of _________ species Metric 5: Number and identity of _________ species Metric 6. Proportion of individuals as _______ sunfish Metric 7. Proportion of individuals as ___________ Metric 8. Proportion of individuals as _____________ Metric 9. Proportion of individuals as _____________
RBI…con’t • Fish Abundance and Condition Metrics (see Table 8-1) Metric 10: Number of individuals in sample Metric 11: Proportion of individuals as hybrids Metric 12: Proportion of individuals with disease, tumors, fin damage, and skeletal anomalies Metric 13: Total fish biomass (optional)
RBI…final calculations involve • See handout “Index of Well-Being (IWB)” • Incorporates: a) _____________ per caught per unit distance sampled b) ______________________caught per unit distance c) ________________________ (i.e., Shannon-Weiner / Shannon-Weaver)