Ongoing Challenges in Many Basins
370 likes | 528 Views
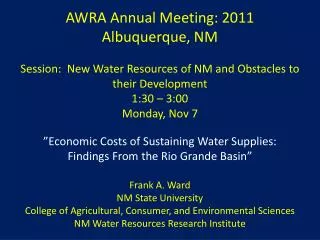
Stockholm World Water Week Session: Hydroeconomic Modeling in Basins: Practice , Challenges and Rewards August 22, 2011 1530 - 1845 Watershed Policy Analysis in the Rio Grande: Insights from Hydroeconomic Modeling Frank A. Ward New Mexico State University USA.

Ongoing Challenges in Many Basins
E N D
Presentation Transcript
Stockholm World Water WeekSession: HydroeconomicModeling in Basins: Practice, Challenges and Rewards August 22, 2011 1530 - 1845Watershed Policy Analysis in the Rio Grande:Insights from Hydroeconomic Modeling Frank A. WardNew Mexico State University USA
Ongoing Challenges in Many Basins • Adaptation to droughts, floods, climate change • Search for resilient water institutions where there are complex watershed processes and constraints • Agronomic • Hydrologic • Meteorologic • Economic • Political • Search for Just, Flexible, Open Water Sharing Agreements • Science-informed policy that’s understandable
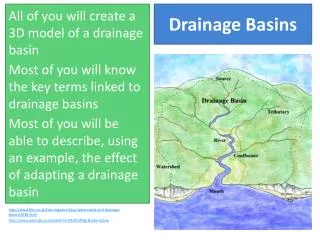
Road Map • Describe Potential Benefits of HM • Graphics • Describe history of one river basin sharing debate (Rio Grande Compact), resulting agreement • Describe principles for framing water sharing debates. • Show how HEM’s can inform water sharing debates • Brief look at one HEM (Rio Grande) • Illustrate the use of HEM for policy analysis • Conclusions
A Role for Hydroeconomic Models? • HM can provide data to inform debates on: • Adaptation to floods, drought, climate change • Ways to share transboundary waters • Irrigation water conservation subsidies • New knowledge or method (e.g., evaporation, ET) • Socially just, economically efficient, politically acceptable water infrastructure • Effective development planning • Cost effective Payment for Environmental Services
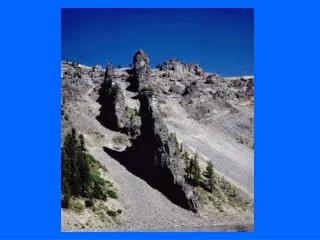
Search for Simple Graphics to inform complex watershed policy debates • Watersheds are scientifically complex • Policy debates add complexity • Few simple graphics can show the choices
History’s Great Graphic: Summarizes Napoleon’s disastrous invasion of Russia in 1812-1813 (Charles Minard, 1869) • Army size (including reserves) by location • Direction of movement • Temperature during retreat by date and location • Limit: Doesn’t show the counterfactual
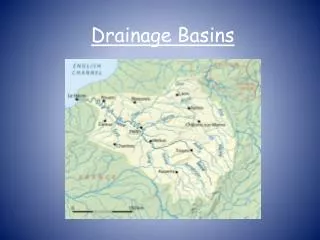
Water Balance: Rio Grande • Rio Grande from Colorado (USA) to US-Mexico border with supplies, gauged flows and depletions by location • Impacts of wet, normal, dry inflows • Impact of water sharing agreement • Rio Grande Compact • US Endangered Species Act • US Mexico Treaty of 1906 • New Mexico – Texas water sharing agreement (2008)
Limits of Basin Graphics • Economic and policy goals: sustainability, sustainable diversion reductions, resilient institutions, minimum econ losses from drought, flood, climate change • In economics, water flows and stocks are inputs. Economic benefits and their just distribution are more important aims. • So we turned to mathematical models of hydrology, agronomy, economics, and institutions
Water Sharing in River Basins: History of Rio Grande Compact • Settlement in southern Colorado USA, late 1800s • Southern NM, El Paso, TX and Ciudad Juarez, MX reduced flows • US-MX Treaty of 1906: 60,000 AF/yr to MX • US Built Elephant Butte Dam (1916) for treaty flows • Lawsuits in the early 1900s over growing demands for shrinking supplies. Increasing any use reduced another supply. • CO-NM-TX: mutual mistrust. • 1920: recognized need for 3 state flow sharing agreement • 1929: draft agreement reached.
Actual sharing arrangement hammered out for Rio Grande • 9 years debate, experiment, negotiation (29-38) • Signed in 1938 • Based on a creative combination of: • Observing historical use patterns • Mathematical formula for predicting historical use • Formula explained how historical use varied in wet v. dry years. • Formula was applied to share water for the future in wet and dry conditions.
Rio Grande Compact Water Sharing Formula • CO deliveries to NM • NM deliveries to TX
Historical Flows into Iraq: Tigris-Euphrates, BCM/yr (1933-2009) • Euphrates = 27.7 – 9.7 * year_after_1992 • Tigris = 21.3 – 6.25 * year_after_1997
Negotiations: haves, lacks, wants: e.g., RG Compact • CO: little carryover storage, wanted dry year flows. Formula reflects that. Low deliveries by CO to NM-TX when supplies are low. • NM: some carryover storage, didn’t need all dry year flows, wanted a growing % of wet year flows. Formula shows that growing %. • TX: 4 years carryover storage. TX gives NM a high % of dry-year flows as to trade for high % flood flows into storage.
Principles to Frame Transboundary Water Sharing Agreements • Equitable and reasonable use • Obligation to avoid significant harm • Cooperation • Information exchange • Notification • Consultation • Peaceful dispute settlement • Rahaman, Finland, 2009, IJWRD, Ganges
Transboundary Water Sharing Procedures • Equal shares of natural supplies (1/3 for ea for 3 states) • Proportional Sharing • Based on land • Based on population • Based on contribution to supply
Transboundary Water Sharing ProceduresHistorical Use • Each community delivers a known quantity of water to its downstream border. • How much? Could be fixed (US-MX in upper RG Basin) or formula based (3 states) because historical use varies • Past years • Past seasons • Past crops • Due to past variable natural inflows • Due to water users leaving basin
Other Sharing Procedures • Based on each country’s need. How to measure? • Based on each country’s productivity of water. In USA, California would get most of the water • Based on each country’s subsistence need (e.g. drinking) • Based on historical use that would have occurred had the country been democratic. E.g, Ethiopia, Nile • Based on what each country can get and keep from others.
Advantages of Transboundary Water Sharing Agreement • Each state develops water independently, needing only to meets downstream obligations…new lands, new reservoirs, growing populations,… • Reduces uncertainty • Future population • Future industry, environmental needs • Each state finds own institutions to develop water to meet growing demands, needs only to meet downstream deliveries. E.g, gw pumped into river: CO - NM. • Each state sets up its own water rights system, thanks to supply certainty.
Role of Hydro-economic Basin Analysis to Inform Water Sharing Proposals • Historical outcomesby country, use, location, and period under actual water sharing agreements • Inflows: headwater supplies • Hydrologic: streamflows, reservoir levels • Agricultural: Irrigated land, farm income, yields, prodn, food self sufficiency • Urban: population, per capita use, price, supply reliability • Environmental: key ecological assets • Economic: Total economic benefits
Role of Hydro-economic Basin Analysis to Inform Water Sharing Proposals • Historicaloutcomesby country, use, location, and period under potentialwater sharing agreements • Inflows: headwater supplies • Hydrologic: streamflows, reservoir levels • Agricultural: Irrigated land, farm income, yields, prodn, food self sufficiency • Urban: population, per capita use, price, supply reliability • Environmental: key ecological assets • Economic: Total economic benefits
Role of Hydro-economic Basin Analysis to Inform Water Sharing Proposals • Future outcomesby country, use, location, and period under actual water sharing agreement A • Inflows: headwater supplies • Hydrologic: streamflows, reservoir levels • Agricultural: Irrigated land, farm income, yields, prodn, food self sufficiency • Urban: population, per capita use, price, supply reliability • Environmental: key ecological assets • Economic: Total economic benefits
Role of Hydro-economic Basin Analysis to Inform Water Sharing Proposals • Futureoutcomesby country, use, location, and period under potential water sharing agreement A • Inflows: headwater supplies • Hydrologic: streamflows, reservoir levels • Agricultural: Irrigated land, farm income, yields, prodn, food self sufficiency • Urban: population, per capita use, price, supply reliability • Environmental: key ecological assets • Economic: Total economic benefits
Use of hydroecomic model • Impacts of alternative policy, supplies, or population by country, use, location, period. • Inflow differences: historic v potential • Hydrologic differences: historic v. potential • Agricultural differences: historic v. potential • Urban differences: historic v. potential • Environmental differences: historic v. potential • Economic differences: Benefits of new policy compared to historic policy. How these changes in benefits vary by alternative future supplies or future populations
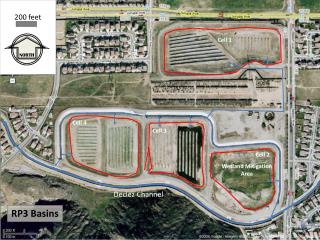
Example Structure of Hydroeconomic River Basin Analysis: Upper Rio Grande
Constraints • Irrigable land, Headwater supplies • Sustain key ecological assets • Hydrologic balance • Reservoir starting levels (sw, gw) • Reservoir sustainability constraints (sw, gw) • Institutional • Endangered Species Act • Rio Grande Compact (CO-NM; NM-TX) • US Mexico Treaty of 1906 • Rio Grande Project water sharing history (NM/TX)
Gauged Flows: Hydro Balance • E.g.: Lobatosgauge (CO-NM border): X(Lobatos_v,1) = X(RG_h,1) - X(SLV_d,1) + X(SLV_r,1)
Potential Institutional Constraints • U.S. Mexico Groundwater Sharing Treaty • U.S. Mexico Water Quality Treaty • Limiting domestic well development • Adjudicate MRG water rights
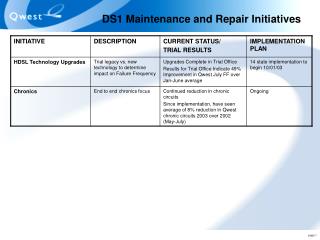
Example Results: Rio Grande Basin • Policy: Subsidize drip irrigation with an upper bound on existing depletions to meet downstream delivery obligations with changing policy
Conclusions and Future Directions • Hydroeconomic Model Advances • Theory • Model design • Computational technique/speed • Needs: Optimization on water development (gw, reservoirs, purification plants, recycling) • Needs: Optimization of water institutions (trans-boundary water sharing, water rights, adjudication, groundwater treaties)