
Uncertainties in Conventional Atmospheric Neutrino Fluxes for Energies Up to 1000 TeV
This study analyzes uncertainties in conventional atmospheric neutrino fluxes (Enu) across various energy ranges (10 GeV to 1000 TeV), highlighting the influence of primary cosmic rays (CR) on calculations. Results indicate discrepancies in flux estimates with significant concerns found in hadronic models and data discrepancies, particularly when comparing different experimental results (CAPRICE, AMS, BESS). The research emphasizes a systematic approach to quantify uncertainties, revealing typical error margins around 10% to 40%, which depend notably on the energy level and input parameters from various studies.

Uncertainties in Conventional Atmospheric Neutrino Fluxes for Energies Up to 1000 TeV
E N D
Presentation Transcript
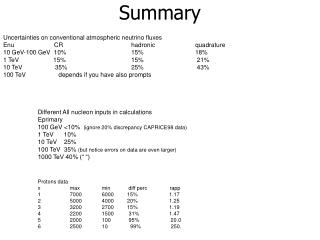
Summary Uncertainties on conventional atmospheric neutrino fluxes Enu CR hadronic quadrature 10 GeV-100 GeV 10% 15% 18% 1 TeV 15% 15% 21% 10 TeV 35% 25% 43% 100 TeV depends if you have also prompts Different All nucleon inputs in calculations Eprimary 100 GeV <10% (ignore 20% discrepancyCAPRICE98 data) 1 TeV 10% 10 TeV 25% 100 TeV 35% (but notice errors on data are even larger) 1000 TeV 40% (“ “) Protons data x max min diff perc rapp 1 7000 6000 15% 1.17 2 5000 4000 20% 1.25 3 3200 2700 15% 1.19 4 2200 1500 31% 1.47 5 2000 100 95% 20.0 6 2500 10 99% 250.
p He Primary CR uncertainties 5% agreement between AMS and Bess98 < 100 GeV BUT CAPRICE -20% ICRC2001 assumes AMS-Bess The region relevant for In red Agrawal dashed et al (first Bartol) New FLUKA and HKKM2004 Assume proton E-2.71 > 100 GeV And ICRC2001 below Primary spectra: data and used fits in calculations
After ICRC2005 x-axis ( 10^x GeV / nucleon) y-axis ( E^2.5 dI/dE (m^-2 s^-1 sr^-1 GeV^1.5) He has much larger errors but weights a little less, though its importance increases with energy Protons x max min diff perc rapp 1 7000 6000 15% 1.17 2 5000 4000 20% 1.25 3 3200 2700 15% 1.19 4 2200 1500 31% 1.47 5 2000 100 95% 20.0 6 2500 10 99% 250.
The ratios of CR inputs to calculations Fluka CR spectrum is similar to HKKM2004 (E^2.71 for p above 100 GeV) HKKM2004/Fluka practically use ICRC2001 < 100 GeV The big difference for FLUKA ar HE is due to the inclusion of the knee Consider a factor of 10 between The primary energy and the neutrino one
The inputs: primary CRs in most recent calculations Main difference between ICRC2001/Gaisser-Honda 2002: CNO+Si-Mg+Fe E-2.7/harder Main difference between ICRC2001/HKKM 2004: He [average of E-2.74+E-2.64]/E-2.64] + protons [E-2.74/ E-2.74(E<100 geV)+E-2.71 (E>100 GeV)] Results: HKKM 2004 is closer to previous Agrawal et al, 1996, harder than ICRC2001 and Gaisser-Honda fit resulting in more through-going muons Gaisser-Honda 2002
The inputs of calculations: primary CR All nucleon inputs (from 2 plots in trasp 3) Eprimary 100 GeV <10% (ignore 20% discrepancyCAPRICE98 data) 1 TeV 10% 10 TeV 25% 100 TeV 35% (but notice errors on data are even larger) 1000 TeV 40% (“ “)
These results agree with: Gaisser astro-ph/0502380 Hadronic model errors I have no magical recipe to estimate the error above Enu = 100 GeV. For Enu<100 GeV many studies (summarized eg in Gaisser-Honda 95) the error is 15%. Recent news are that: DPMJET-III is about 15%-20% lower than L3 m data (up to 2 TeV of muon energy - see the plot below that quantifies how much the change dpmjet), TARGET yields too many kaons at HE and the authors correct it. For fluka we are still making up statistics between 1-10 TeV of neutrino energy (so ignore for now the decrease in the blue line - I’ll have the correct trend shortly. It is more similar to DPMJET than TARGET For prompt neutrinos 2 order of magnitude of incertainty
Hadronic Mode I would say then that a 20% at 1 TeV is reasonable especially thanks to checks against L3 (though fluka has not been benchmarked against these muon data we know the hadronic model are close) At 10 TeV may be the same or increase and above for sure it increases up to a factor of 2. The differences between calculations are in the plot below but as I said the blue curve for the moment is still with insufficient statistics So at 1 TeV you see about a 15% Difference and at 10 TeV at least 25%


