Download
1 / 20
200 likes | 422 Views
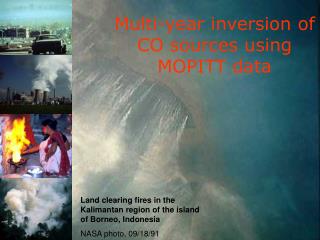
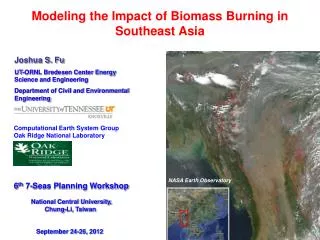
source: NASA, AFP. Modeling of Biomass burning with the NASA GEOS-5 modeling and data assimilation system. Anton Darmenov , Arlindo da Silva GMAO Research Meeting, 31 March 2011. Outline. Biomass burning emissions Background The QFED v2.1 fire emissions inventory Fire weather index

E N D
source: NASA, AFP Modeling of Biomass burningwith the NASA GEOS-5 modeling and data assimilation system Anton Darmenov, ArlindodaSilva GMAO Research Meeting, 31 March 2011
Outline • Biomass burning emissions • Background • The QFED v2.1 fire emissions inventory • Fire weather index • The Russian fires of 2010 – a case study • Performance of the coupled GEOS5/GOCART system • Performance of the GAAS aerosol assimilation system • Improving the biomass burning emissions in GEOS5
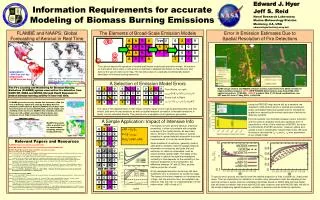
Quantifying biomass burning emissions • Bottom-up approach Ex = EFx M Ex – emission load of species x EFx – emission factor for species x for the specific vegetation type/biome M – biomass burned M = A * B * β A– area burned B– biomass load/density β– combustion completeness / fraction of available fuel burned • Top-down approach • Energy released per unit dry mass is 16-22 MJ/kg Etot = Erad + Econv + Econd + Evapor Erad ~ Etot • Remote sensing Fire Radiative Power (FRP) pk– fractional area of the k-th fire component Tk– temperature of the k-th fire component FRPMIR ~ FRPtrue
The Quick Fire Emission Dataset • QFED v2.1 • Utilizes FRPs from MODIS Terra and Aqua • Calibrated against GFED v2 • Provides daily emissions of CO, CO2, SO2, OC, BC and PM2.5 at a ¼ degree resolution QFED uses the IGBP vegetation map and four types of biomes – tropical and extra-tropical forests, savanna and grassland.
QFED calibration The independent calibration of MODIS Terra and Aqua FRPs provides redundancy in case of data loss from one of the satellites.
QFED calibration (cont.) Time series of GFED and QFED global monthly mean CO emissions for the period of 2003-2007.
The extreme Summer of 2010 +10 °C Global Land Surface Temperature Anomalies, July 2010 source: http://earthobservatory.nasa.gov • Model the Russian Fires of 2010 with GEOS-5 • Evaluate the fire emissions • Investigate the performance of the newly developed aerosol data assimilation system • Air quality applications Drought and Air Quality, August 2010 source: http://earthobservatory.nasa.gov
Studying the Russian fires with GEOS-5 • Model setup • 0.5°x0.625° resolution • Intermittent replay using the NASA MERRA reanalysis • GOCART aerosol module • Fire emissions inventory • QFED-v2 • FRP based fire emissions – MODIS Terra and Aqua • GAAS - aerosol assimilation system • Validation • AOT - MODIS, MISR • Visibility – WMO stations
Fire emissions adequacy Far-Eastern Region Central Region The fire emissions are likely underestimated in the Central Region.
Validation of modeled AOT Observed AOT GEOS-5 AOT time averaged AOT: 20 Jul – 20 Aug, 2010
Assimilation of AOT Observed AOT time averaged AOT: 20 Jul – 20 Aug, 2010 Modeled AOT
Air quality applications – PM2.5 time averaged PM2.5: 20 Jul – 20 Aug, 2010 Assimilating AOT also improves the surface PM2.5 concentrations. unhealthy μg/m3
PM2.5 and Visibility in Moscow Moscow – Visibility [km] GEOS5 WMO unhealthy reported VIS < 1000m The GEOS-5/GAAS visibility is overestimated (higher than the measured values), which suggests that the PM2.5 are underestimated.
Current Developments • MERRA Fire Weather Index • Follows the Canadian Forest Fire Weather Index algorithm • Using meteo fields from MERRA • Improving the biomass burning emissions in GEOS5/GOCART • A diagnostic study of fire emissions strengths on a regional level • Use the results in the next version of QFED
MERRA FWI • The FWI components account for the effects of fuel moisture and wind on fire behavior. • The six standard components provide numerical ratings of relative potential for wildland fire. source: CFFWI
Improving the fire emissions in GEOS-5 GEOS-5/GOCART tends to underpredict the AOT in the areas affected by biomass burning.
Addressing the weak fire emissions • Methodology • To correct the fire emissions strength we performed multiple linear regression assuming that in the regions affected by fires only the biomass burning and anthropogenic AOT components need adjustment AOT = (AOTDU + AOTSS + AOTXX+αBBAOTBB + αANAOTAN
Results from the diagnostic study αBB = 3.4 αAN = 0.01
Results from the diagnostic study αBB = 2.5 αAN = 0.3
Results from the diagnostic study αBB = 1.8 αAN = 1.1