Download

1 / 29
290 likes | 472 Views
Coachella Valley Overview of Growth and Transportation. Coachella Valley Association of Governments John Wohlmuth Executive Director. Coachella Valley Association of Governments. Blythe. SALTON SEA. CVAG Population Growth 1990-2007. Population (January Count).

E N D
Coachella Valley Overview of Growth and Transportation Coachella Valley Association of Governments John Wohlmuth Executive Director
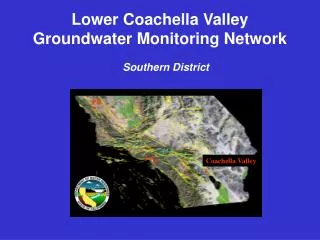
Coachella Valley Association of Governments Blythe SALTON SEA
CVAG Population Growth1990-2007 Population (January Count) Source: Riverside County Projections, June 2006
Coachella Valley Population Growth Comparison 1990-2007 21.3% 16.6% 26.5% 73.6% 95.6%
Population Growth2006/2007 2006 2007 Coachella Valley 3.8% Coachella Valley 4.3% Riverside County 3.4% Riverside County 3.6%
Employment / Jobs 2007 Source: Riverside County Progress Report 2007.
Taxable Sales(in $1,000s) Source: Riverside County Progress Report 2007.
Estimating Coachella Valley Growth2000-2035 RTP Projections Source: Riverside County Projections 2006..These numbers are estimates and rely on the assumptions that population densities and current growth rate remain constant.All agricultural land is considered as developable for this analysis.
Median Household Income of CVAG Cities Source: Capital Realty Analysts Market Study.
Median Home Price of CVAG Cities2007 Source: Riverside County Progress Report 2007.
Median Age (yrs.) of CVAG Cities Source: Riverside County Progress Report 2007.
Unemployment Rate of CVAG Cities2007 Source: Riverside County Progress Report 2007.
Persons per Household in CVAG Cities2007 Source: Riverside County Progress Report 2007.
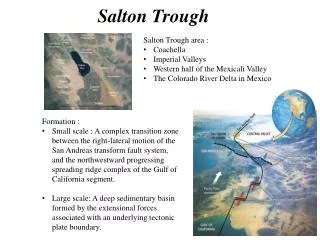
Transportation in the Valley Salton Sea
Mean Number of Household Trips Per Day 9.0 8.0 8.1 7.0 7.4 7.03 The overall number of trips by households in the area increased by 19.3% from 1995 to 2004. 6.0 6.56 5.5 5.0 5.5 5.06 5.0 4.5 4.69 4.0 3.0 2.0 1.0 0.0 All Households Year-round Multi Retired Year-round Single Retired Year-round Multi Non-retired Year-round Single Non-retired 1995 2004
Top Destinations for Residents of the Coachella Valley 14,100 trips to the area including Eisenhower Medical Center (CBkGrp 18657) 11,900 trips to the area with Palm Springs Airport (CBkGrp 17879) 19,200 trips to the area including Costco and Home Depot (CBkGrp 18287) 14,400 trips to the area with Fantasy Springs Casino (CBkGrp 18402) Estimated Number of Daily Trips to the Area 10,000-14,999 15,000-24,999 42,200 trips to the area including Wal-Mart, Lowes, and La Quinta High School (CBkGrp 19450 & 19323) 36,600 trips to the area including Town Center Mall and the College of the Desert (CBkGrp 19188 & 19330) >25,000
How Long Household Trips Took to CompleteBy percentage of all trips completed by Household Survey Participants 21.6% 22.6% 20.6% 12% 14.5% 8.5% % % % % % % Avg: 20.3 Minutes
Coachella Valley Top 20 Locations with Highest Traffic Growth in 2007
Future Interchange Projects Portola Avenue/I-10 Jackson Street/I-10 McNaughton Parkway/Avenue 50/I-10 Duval Street/I-10 Golf Center Parkway/I-10 SR86S/Avenue 50 SR86S / Avenue 52 SR86S / Airport (Avenue 56) SR86S / Avenue 62 SR86S / Avenue 66
Recently Completed Road Projects Jefferson Street Phase II (SR111 to Indio Boulevard) Varner Road from Adams to Jefferson Avenue 48 Bridge across All American Canal Fred Waring Drive Palm Desert city limits to California Street
Road Projects under Construction or soon to be under Construction Monterey Interchange and Monterey Avenue North of I-10 Monroe Street from Avenue 52 to I-10 Varner Road from Adams to Jefferson Portola Avenue Bridge at Whitewater River Channel Madison Street from Avenue 52 to Indio boulevard Monterey Avenue north of I-10
Road Projects under Construction or soon to be under Construction (Continued) Ramon road north side from Los Alamos to Bob Hope Hwy 111 from Palm Desert to La Quinta in Indian wells Miles street Whitewater bridge to Clinton Fred Waring Dr. from California to Washington Street Country Club Drive to Diana Shore Drive Cook Street widening from Fred Waring to Frank Sinatra