Download
1 / 68
690 likes | 942 Views
Sea level changes impact on saltwater intrusion into the Gauthami-Godavari River Estuary. Thota V. Narasimha Rao Scientist F, National Institute of Oceanography, Regional Centre, 176, Lawson’s Bay Colony, Visakhapatnam-530 017. OBJECTIVE. Characterize salinity intrusion extent in the

E N D
Sea level changes impact on saltwater intrusion into the Gauthami-Godavari River Estuary Thota V. Narasimha Rao Scientist F, National Institute of Oceanography, Regional Centre, 176, Lawson’s Bay Colony, Visakhapatnam-530 017.
OBJECTIVE Characterize salinity intrusion extent in the Gauthami-Godavari River Estuary
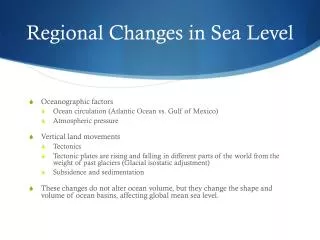
INTRODUCTION • The impacts of sea level changes on coastal areas may cover many aspects including: • Impacts on water resources, • agricultural and • health resources in the coastal areas. • Usually impacts are exacerbated by other phenomena: • such as subsidence, • presence of ground water aquifers and • coastal agriculture. • We shall consider the saltwater intrusion impacts in some detail.
INTRODUCTION • Saltwater intrusion is a direct impact on: • Groundwater resources, • Soil salinity, • Agricultural productivity and • Quality in the coastal zone. • The Godavari delta and its deterioration due to saltwater intrusion is an example. • Impacts of saltwater intrusion include: • Increase of soil salinity, • Deterioration of land productivity, • Socioeconomic & • Health implications. • It may lead to group migration of farmers looking for jobs else where.
INTRODUCTION • Sea level is rising more rapidly as a result of climate change, • Posing risks to estuaries, • Aaquifers, Wetlands, Lowlands, Beaches, and Infrastructure. • Assess the potential impacts of sea level rise on Gauthami-Godavari drinking water systems . • To identify systems whose intakes are vulnerable to sea level rise. • Sea level rise could increase the salinity of an estuary by altering the balance between fresh water and salt water. • The implications of sea level rise for increasing salinity have been examined in the Gauthami-Godavari River estuary.
INTRODUCTION • By correlative analysis of • Salinity, • Discharge, • Tidal level & • Calculation of two-dimensional salinity distribution of the Gauthami-Godavari River estuary, • The changes of the intensity • Lasting hours of saltwater intrusion at Stas 1-4 & • Changes of salinity distribution in the Gauthami-Godavar River estuary observed during 1989-1990 • Estimations to be made for future sea level rises of 50–100 cm.
INTRODUCTION • Major concern for drinking-water utilities from sea-level rise is: • The migration of saltwater upstream into fresh waters where drinking-water intakes are located. • In India, water available for agriculture has fallen nearly 10% during the last decade. • Sea-level rise scenarios: • To evaluate the effects of potential sea-level rise on Gauthami-Godavari River estuary
INTRODUCTION • Future sea-level rise scenarios for the Indian region for the 21st century: 1) 30 to 40 centimeters (cm) total by the year 2100; 2) up to 50 cm total by 2100; & 3) up to 100 cm total by 2100. • We refer to these scenarios as 1) 30- cm rise, 2) 50- cm rise, & 3)100- cm rise, respectively.
INTRODUCTION • Linear Mean Sea level (MSL) trends and 95% confidence intervals in feet/century 1st year Last year Year Range MSL trend +/-95% confidence • Vizag 1937 1996 60 0.18 0.17 • Chennai 1916 2003 88 0.10 0.14 • Mumbai 1878 1994 117 0.24 0.08 • Cochi 1939 2004 66 0.45 0.11
INTRODUCTION Salinity intrusion modifications can significantly impact established water uses like- Agricultural, Domestic & Industrial water supply.
INTRODUCTION The extent of salinity intrusion depends on: The balance between Fresh water discharges & Saltwater flow from the sea.
METHODOLOGY • To develop a methodology to assist the operators of the reservoir • Planning the release of water down the river • To control the salinity in the estuary
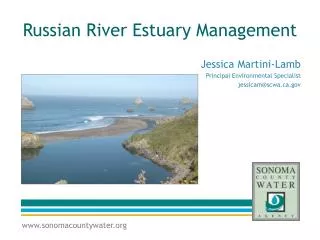
GAUTHAMI-GODAVARI RIVER ESTUARY1-4 Observation stations Gauthami-Godavari River Estuary is located in central East Coast of India, which discharge to the Bay of Bengal
River discharges • The Godavari reservoir at Dhawaleswaram is designed to control flooding and provide irrigation water. • The Godavari River has fresh water flows ranging from 50 to 3800 m3/s • The dam is being built only 60 km upstream of the river mouth and near the tidal reach • The Godavari River has fresh water flows of <100 m3/s during Dec. to April. • Max. freshwater flow of 3800 m3/s in Aug. during flood season Variation of average monthly discharge (m3 s-1) at Dawaleswaram in the Godavari river
Different River dischargesTemperature (oC) & Salinity (PSU) • Sea level rise could increase the salinity of an estuary by altering • the balance between fresh water and • salt water. • Million people are served by coastal surface water systems that are unprotected (by a dam or other structure) from sea-level rise. • People are ranked highly vulnerable to salt water intrusion, meaning they are unprotected& • Within a tidal fresh-water reach with estuarine wetlands nearby (indicating slightly saline water a short distance downstream). • Observations indicate that sea levels have risen from four to eight inches in the 20th century Temperature (oC) and Salinity (PSU) at Stas 1-3 during (A) Winter (Dec. 1989) (B) Dry (April 1990) & (C) Flood (July 1990) season
Temperature (oC) & Salinity (PSU)Dry season Vertical profiles of Temperature (oC) & Salinity (PSU) at Stas 1-4 in Dry season, April, 1990
Salinity intrusionSurface & Bottomalong main channel • Models indicate the possibility of an additional rise of eight to 15 inches over the 21st century. • Changes will vary locally, and impacts will vary as well. • Assessments of the possible consequences of climate change and climate variability on water quality. • Our focus in these assessments has been on the ability of drinking water systems to continue to provide clean, safe water as climate changes especially on surface water systems. • Our concern is the possible impact of sea level rise and salt-water intrusion on community water systems. (A) Temperature (oC) at (a) Surface and (b) near Bottom (B) Salinity (PSU) at (a) Surface and (b) near Bottom along the main channel of the Gauthami-Godavari Estuary
Temperature-Salinity (T-S) plots Temperature-Salinity (T-S) plots from Dec. 1989 to Oct. 1990 at Stas 1-3for (a) Surface and (b) near Bottom.
Temperature-Salinity (T-S) plots Temperature-Salinity (T-S) plots at Stas 1-3. The month is indicated by the first three letters
Salinity intrusion • In an effort to assess the potential magnitude of the problem, we developed a screening methodology to identify systems that are potentially vulnerable. • Factors other than sea level rise will impact the vulnerability of freshwater intake points to salt intrusion. • For surface water systems: • River flow, • The distance of the intake point from the salt front & Withdrawal rates are among the factors • that can influence vulnerability & • Complicate the evaluation of that vulnerability. • Multiple factors affect the vulnerability of freshwater intake points at any one location & • local changes in sea level deviate from the global average. Salinity (PSU) in (a) Winter (Dec. 1989), (b) Dry (April 1990) and (c) Flood (July 1990) seasons
Salinity Vs. Scaled axial distance x/L Mean salinity (PSU) at Stas 1-4for Winter & Dry season • This straight line fits the mean value distribution surprisingly well (R2=0.99) • and is given by • S = 29.25 - 45 (x/L) • Mean axial salinity gradient is dS/d(x/L) = -45 x 10-3 or • dS/dx = -1.5 x 10⁻³ km-1. • This simple fit predicts the landward end of salt intrusion (S = 0 at x/L = 0.65). • The upstream limit of the mean position of the salinity intrusion is located about 40 km from the mouth. Salinity Vs. Scaled axial distance x/L. The numbers 1-4 show mean salinity (PSU) at four observation stations for winter and dry season
Estuarine classification Station Nos. 1-3 • For ground water system: • Withdrawal rates, • The depth and gradient of the aquifer & Recharge rates affect vulnerability. • Even within a small geographic area: • these factors vary, making it difficult to provide reliable estimates of impacts for the large population of coastal drinking water systems. A diagram of estuarine classification. 1-3 are station numbers
APPROACH • Screening analysis to identify systems withdrawing water • from tidal & freshwater reaches of rivers. • Systems vulnerable to sea level rise (as well as more frequent droughts, another possible effect of climate change) due to the potential for the intake water to become brackish. • Determine the locations and characteristics of water supplies BASINS (Better Assessment Science Integrating Nonpoint and Point Sources). • Latitude and longitude coordinates for Public Water System (PWS) intake points. • Sort-out the sites by elevation class using 90 meter-square area Digital Elevation
APPROACH Each intake point was labeled according to the following code: 0 = below 0.5 meters; 1= 0.5-1.5 meters; 2 = 1.5 to 2.5 meters; 3 = 2.5 to 3.5 meters; 4 = above 3.5 meters. Although the elevation data apply to the average elevation of the land in a 90 meter-square area around the intake and not to the intake itself (which is below the level of the land), For screening purposes we considered intakes below 3.5 meters elevation to be in low-lying areas and therefore vulnerable to sea level rise. This screening step yielded 156 low-lying, coastal surface water intakes. Working with these surface water intakes in low-lying areas, we then screened for intakes protected by a dam.
APPROACH • The next challenge is to find an indicator of vulnerability to sea level rise. • Sites closest to brackish water would be the first to be affected by a migrating salt front, and needs an indicator of the proximity of brackish water to the remaining intakes. • Wetland plants are often grouped by biologists into freshwater, brackish, and saltwater species. • The boundary between estuarine and freshwater wetlands is defined by salinity, during average annual flow, of 0.5 ppt (PSU, Practical Salinity Units).
APPROACH • A PWS drawing water at 0.5 parts per thousand or higher • Would have difficulty meeting the EPA’s secondary Maximum Contaminant Level (MCL) for chloride and • Total dissolved solids (2.5 parts per million (ppm) or • 0.0025 ppt and 5 ppm or 0.005ppt, respectively (http://www.epa.gov/safewater/mcl.html) • Unless it used desalination techniques. • Therefore, • An intake in an estuarine area might face salinity problems now, and • One in close proximity to an estuary might be vulnerable to sea level rise.
APPROACH • Proximity of an estuarine wetland is an indicator of vulnerability for a public water system intake. • Intake coordinates from locations and characteristics of water supplies generate maps of the area around the intake. • These maps were overlaid on the wetland maps to measure the distance from the intake to the nearest estuarine area. • Intake distance from 0 km (i.e., the intake is in an estuary) to the nearest estuary • .
APPROACH • Intake which is within an estuary • Intake seems to be within one km of an estuary • Fresh water creeks separated from the estuary by land & are designated as being at medium vulnerability. • Low-lying ponds, having low vulnerability to contamination from sea level rise
APPROACH • An area that is home to estuarine plants might be only slightly brackish & • Suitable for a drinking water supply. • Water systems may use • De-salinization processes, • Enabling them to meet the EPA’s secondary standards for salt. • Public Water System (PWS) intake point of Yanam Administration: Relocated its intake 20 km upstream in 1985
APPROACH • The original intake continued to be used To provide a backup source, though it was useable only at low tide. • In 1995 it was taken out of use after a cyclone destroyed it. • It would be good to model the migration of the salt front up each coastal river basin in order to get a more specific understanding of PWS vulnerability.
CONCLUSIONS • All the plants reported that they have had salinity problems • Following storms or during droughts • The vulnerability of the system depends on the occurrence of • drought • as well as sea level rise, • yet a coping strategy should still be developed. • Better screening tools • Capture vulnerabilities such as this • Should be developed.
CONCLUSIONS • Given that some systems are vulnerable & • Others may be vulnerable, • It is important to consider adaptation strategies. • Examples include those already employed by the system operators: • Operate the plant at low tide; • Prepare for storm surges by storing fresh water or • Construct barriers to block the storm surge & • Move to higher ground when it is no longer practical to rely on the existing intake.
CONCLUSIONS • Each of these options comes with costs • That will have to be borne by the communities being served. • Other adaptation options exist, • Some of which are foresighted • in their consideration of future sea level rise. • It would be a shame for a permit to be issued • for a new system and • a community to invest in a capital project • whose useable life will be cut short by salt water intrusion.
CONCLUSIONS • Salinity intrusion reaches a river section located about 40 km upstream the river mouth. • For more frequent river flows, the salinity gradients occur mainly downstream of the Sta. 2 (10 km from river mouth). • Achieved results will be used as an important auxiliary source of information in order to select gauge stations for measurements of tidal water elevations, current velocity, and salinity concentrations. • The developed model can be used to establish discharge operational schemes of the upstream hydropower plants safeguarding downstream water intakes.
Salinity intrusion RESULTS AND DISCUSSION • Sea level rise will cause an intensification of saltwater penetration into rivers and freshwater canals, • Which could be further increased in summer by reduced river flows. • The larger extension of the salt wedge would prevent the use of freshwater for agricultural purposes & • could lead to salt accumulation in soil. • Saltwater penetration would influence the distribution & • Consistence of the typical estuarine communities • Storm surge is one of the major natural calamities along the coast of the Godavari River Delta region.
Acknowledgement The author would like to thank to the Administration of Superintendent Engineer, Irrigation Department, Dhawaleswaram, A.P. & Naval Hydrographic Office (NHO) for the authorization to use River Discharge and Tidal data in this work.
Background and Justification • The studies on storm surges along the East Coast of India is multifaceted due to the cyclones that develop over the Bay of Bengal flooding the low-lying coastal regions. • Synoptic disturbances (cyclones) originate during pre-monsoon (Apr-May) and post-monsoon (Oct-Nov). • Tropical depressions: max. winds of 60 km/hr, • Tropical storms: max. wind speeds between 60 and 120 km/hr • Hurricanes/Typhoons: max. wind speeds of 120 km/hr influence the upper ocean dynamics. • The effect of tropical cyclones cause immense damage by wind, pressure, rain and indirectly through storm surges on the East Coast of India. • Contd….
The initial field needed for the model run in the Bay of Bengal requires to be prepared including the effect of cyclones in generating storm surges and waves. • Surge computations by using a model. • Significant input in the surge prediction is the predicted track of the cyclone. • The system significantly affects the East Indian Coastal region during pre and post monsoon seasons by causing flooding across the shelf along the coast.
Narasimha Rao (1998) Proc. Vol. of the Int. Conf. on “Natural and Technological Hazards”, Int. work shop on “Storm surges”, S.V.University,Tirupati, Sponsored by UNESCO (IOC).
Fig. 5 Location of all earthquakes from 26th December 2004 to now
Fig. 6 Tsunami 26 December 2004 prepared by INGV Istituto Nazionale Geofisica e Vulcanologia, Indonesia
Fig. 6 In deep water the Tsunami cannot be noticed, but in shallow water it rapidly increases in height as it slows.
Fig. 7 Equipment for fixed stations:(1) Acoustic Doppler Current Profiler (ADCP): for measuring water column velocity and pressure,(2) Acoustic Doppler Velocimeter (ADV): for measuring water velocity, temperature, pressure and bed elevation and (3) Optical Backscatter Sensor (OBS): for measuring near-bottom and mid column suspended sediment concentration,Frame for bottom mooring
Rationale • Natural phenomenon like storm surges and tsunamis cause abnormal fluctuations in sea level along the coasts. • The tide gauges installed to measure the rhythmic raise and fall of sea levels due to astronomical tides are also capable of recording such abnormal fluctuations in sea levels. • The analysis of tide gauge records along the Indian coast and elsewhere showed that the recent event of tsunami, that occurred on 26 December 2004, was well recorded by the tide gauges in the Indian Ocean.