
Abstract
Callulops2460. 100. 100. Callulops2461. Callulops2913. Callulops9640. 100. Callulops9587. Callulops9669. 100. 100. Callulops9668. Callulops8656. Callulops45452. 100. Callulops3207. 96. Callulops2082. Cfoya9875. 98. 96. 98. Callulops47626. Cmicotis6020. Oreophryne9666. 100.

Abstract
E N D
Presentation Transcript
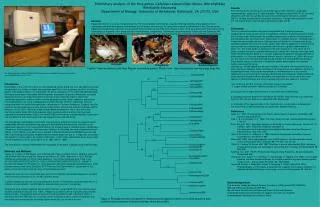
Callulops2460 100 100 Callulops2461 Callulops2913 Callulops9640 100 Callulops9587 Callulops9669 100 100 Callulops9668 Callulops8656 Callulops45452 100 Callulops3207 96 Callulops2082 Cfoya9875 98 96 98 Callulops47626 Cmicotis6020 Oreophryne9666 100 Oreophryne9594 Callulops2084 Cmicotis6145 94 Xenobatrachus3137 100 Cfoya9915 Callulops6131 100 Cfuscus7706 Austrochaperina2294 97 97 Callulops46356 Hylophorbus3080 Hylophorbus2229 Results The 12S data matrix consisted of a total of 907 bp for each individual, using indels represented by - (gaps) as a 5th state character. The data contained 340 (37.5%) constant characters, 219 (24.1%) variable but parsimony-uninformative characters and 348 (38.4%) variable and parsimony-informative characters. A single most parsimonious tree of 1413 step long was retrieved with a consistency index of 0.61. Discussion The tree contains two clades that group Hylophorbus and Oreophryne species, suggesting that these two genera are monophyletic. However, Oroephryne clusters inside the Callulops clade. Furthermore, the samples representing the genera Austrochaperina and Xenobatrachus also show closer relationships to Callulops samples. Consequently in these preliminary results the genus Callulops does not cluster as a monophyletic group. Callulops samples cluster into two major clades. Also, the two species of C. micotis do not show a sister-taxa relationship as expected and they have a genetic differentiation of about 11%. The same pattern is observed in the two samples of C. foya, which do not cluster together and show a genetic differentiation of about 13%. Among other frogs, level of genetic differentiation above 3% has been suggested to represent interspecific levels of differentiation (i.e., they are considered different species, Vences et al., 2004). We do not use this value as an absolute threshold but did consider the marked difference between these genetic values as indicative of substantial genetic differentiation that warrants further analyses in this group. Callulops sp. (46356) appears to be closer related to the genus Austrochaperina than to other species of Callulops. Given that frogs in these genera are very difficult to identify on morphological basis, this could be interpreted as a misidentification of the voucher specimens (we are verifying the individual identity with our collaborator Stephen Richards at the Australian Museum where specimens are deposited) or it could represent a new species of Austrochaperina that may morphologically resemble species of Callulops. I am continuing with this research and further analyses will include: 1) Larger sample sizes with additional samples of Callulops 2) Samples from a larger representation of other New Guinea Microhylid 3) Including sequence data for the 16S ribosomal mtDNA, which evolves at a slower rate than the 12S and may help us to understand older divergences 4) Integration of the sequence data to the morphometric, morphological, bioacoustical, and natural history data obtained by our collaborator Stephen Richards. Preliminary analysis of the frog genus Callulops relationships (Anura, Microhylidae)Relebohile SekonyelaDepartment of Biology, University of Richmond, Richmond, VA 23173, USA Abstract Papua New Guinea is an area of high biodiversity. The frog amphibian communities are part of this high diversity. Many species remain undescribed and their phylogenetic relationships are not known. Among frogs, the family Microhylidae is represented in New Guinea by the subfamily Asterophryinae and these are among the frogs for which we have the least amount of data. Here we present preliminary result on the relationships of 6 genera of this group of frogs (Xenobatrachus, Hylophorbus, Oreophryne, Austrochaperina, Cophixalus and Callulops). We sequenced a fragment of the 12S mitochondrial ribosomal DNA of these genera and we will present a preliminary hypothesis of relationships. Callulops Oreophryne Austrochaperina Figure 1 Representatives of the New Papuan microhylids genera. Photos from:http://ecologyasia.com/verts/png-frogs.htm Ms. Rele Sekonyela aligning Callulops’ DNA sequences using Align-R software; sequences were obtained using Li-Cor 4300. Introduction Microhylidae is one of the most diverse and widespread anuran group with over 400 species currently recognized (Frost, 2008); the family encompasses about 8% of all frog species and 20% of total frog genera. The family consists of 11 subfamilies, the genus Callulops is in the subfamily Asterophryinae, the largest subfamily of microhylids with 218 species clustered in 18 genera. Microhylids are widely distributed and they are found throughout most tropical and temperate regions. Most of the subfamilies represent a radiation within a limited geographical area. Major radiations, and most of microhylid diversity, are found in Madagascar and New Guinea. Of the 11 subfamilies currently recognized within the family, Asterophryinae is distributed in Southern Philippines, Sulawesi, and Bali, eastward through Indonesia and New Guinea to New Britain and extreme northern Australia, and the Moluccas (Frost, 2007); almost all species exhibit direct development, that is, they lack a free swimming tadpole stage. Microhylid tadpoles share several cranial characters that have been regarded as synapomorphies (Ford & Cannatella 1993) but the group is morphologically conservative and it is difficult to find morphological derived characters that unite the family. The phylogenetic relationships of microhylid frogs are poorly understood and many species remain undescribed. We are working with frog species of the subfamily Asterophryinae and have so far sequenced fragments of the mitochondrial DNA of the following genera: Xenobatrachus, Hylophorbus, Oreophryne, Austrochaperina, Cophixalus and Callulops. In this study, we used a fragment of about 900 bp of 12S mtDNA as the basis for our analysis of Microhylid individuals. MtDNA has been used often in generating phylogenetic models of closely related organisms due to: 1) high rates of mutation with respect to nuclear genes, 2) maternal inheritance, 3) short allele coalescence times, and 4) ease of PCR amplification (Avise, 2000; Moritz et al., 1987; Moore, 1995). The main goal is to assess relationshipsamong species in the genus Callulops using molecular data. References Avise, J.C. 2000. Phylogeography: the history and formation of species. Cambridge, MA: Harvard University Press. Ford, L. S. & Cannatella, D. C. 1993. The major clades of frogs. Herpetological Monographs 7, 94-117. Frost, Darrel R. 2007. Amphibian Species of the World: an Online Reference. Version 5.1 (10 October, 2007). Electronic Database accessible at http://research.amnh.org/herpetology/amphibia/index.php. American Museum of Natural History, New York, USA. Hillis, D. M., Moritz, C., Mable, B. K. 1996. Molecular Systematics 2nd edition. Sinauer Associated Inc. Sunderland, MA. Moore WS. 1995. Inferring phylogenies from mtDNA variation: mitochondrial gene trees versus nuclear gene trees. Evolution49: 718–726. 103: 25–38. Moritz C, Dowling TE, Brown WM. 1987. Evolution of animal mitochondrial DNA: relevance for population biology and systematics. Annual Review of Ecology and Systematics18: 269–292. Swofford, D.L. 2001. PAUP*: Phylogenetic Analysis Using Parsimony. Sinauer Associates, Sunderland, MA. Thompson, J.D., Gibson T.J., Plewniak, F., Jeanmougin, F., Higgins, D.G. 1997. The ClustalX windows inferface: flexible strategies for multiple sequence alignment aided by quality analysis tools. Nucleic Acids Research24: 4876-4882. Vences M, Kosuch J, Rödel MO, Lötters S, Channing A, Glaw F, Böhme W. 2004. Phylogeography of Ptychadena mascareniensis suggests transoceanic dispersal in a widespread African-Malagasy frog lineage. Journal of Biogeography31: 593–601. Materials and Methods Twenty-six samples of Microhylidswere obtained from Papua and New Guinea. DNA was extracted and isolated from muscle and liver tissue as per Hillis et al., 1996. Segments of 12S (~900 bp) mtrDNA were amplified by PCR for each specimen. The primers employed were: 12Sa 5’-AA ACTGGGATTAGATACCCCACTAT-3’, 12Sb 5’-GAGGGTGACGGGCGCTGTGT-3’, 12Srds1 5’-GGTACCGTCAAGTCCTTTGGGTT-3’, and 12Stphef 5’-ATAGCRCTGAA RAYGCTRAGATG-3’. PCR products were purified using GeneElute PCR Clean-Up Kits (Sigma-Aldrich), sequenced via the dideoxy chain-termination method (using infrared labeled primers). Sequences were ran in 6% acrylamide gels using Li-Cor DNA4300 automated sequencers available at the University of Richmond, Dr. De Sá’s research group. Callulops samples on the tree not assigned species names are individuals tentatively identified as C. robustus or unassignable to current species and potentially represent new species. Sequences were visually inspected and corrected manually using AlignIR V2.0, then aligned using ClustalX software (Thompson et al., 1997). Ambiguous positions were re-inspected and corrected where possible. Phylogenetic analysis was performed using PAUP 4.0b10 (Swofford, 2001), a heuristic search with NNI was run on the data matrix; bootstrap analysis using 100 replicates was performed on the resulting tree, bootstrap values above 95% are shown in the tree. Acknowledgements This work was funded by National Science Foundation (USA) award DEB-0342918 to RdS and WRH and subsequent NSF-REU. We also thank the University of Richmond School of Arts and Sciences Undergraduate Research Committee for support in the form of a Summer Undergraduate Fellowship and Research Grant. Figure 2. Phylogenetic tree of 6 genera in Asterophryinae subfamilybased on mtrDNA sequence data. Numbers above branches indicate bootstrap values above 95%.


