Phase Changes
Phase Changes. Chapter 11. Vaporization. An endothermic process in which the intermolecular attractions of a liquid are broken releasing molecules as a gas. Δ H vap, T he heat of vaporization is the heat required to vaporize one mole of a liquid at 1 atm. Vapor Pressure.

Phase Changes
E N D
Presentation Transcript
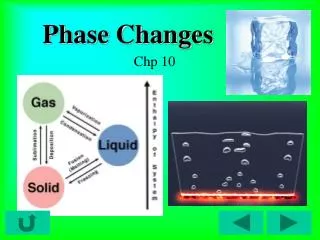
Phase Changes Chapter 11
Vaporization • An endothermic process in which the intermolecular attractions of a liquid are broken releasing molecules as a gas. • ΔH vap, The heat of vaporization is the heat required to vaporize one mole of a liquid at 1 atm.
Vapor Pressure • In a closed container, some liquid is initially changed to a gas. • Eventually the rate of evaporation equals the rate of condensation. • Vapor Pressure is at equilibrium.
Vapor Pressure • Vapor pressure varies depending on the volatility of a liquid. • Volatility is the ease of a liquid to form a gas. • Liquids with low IMF’s have high volatility. Large molecules tend not to be volatile. • Water is a small molecule, but is not highly volatile. Why?
Vapor Pressure increases with temperature • Increasing the average kinetic energy of the molecules, means they require less additional energy to overcome their intermolecular forces to become a gas.
Calculating Enthalpy of vaporization • ln(Pvap) = - [ΔHvap/R] x (1/T) +C • R is universal gas constant • C is the constant characteristic of a given liquid. • ln is the natural log. • y=mx+b • Plotting the natural log versus 1/T in kelvin gives a straight line.
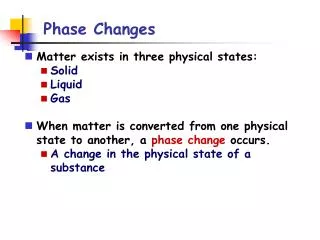
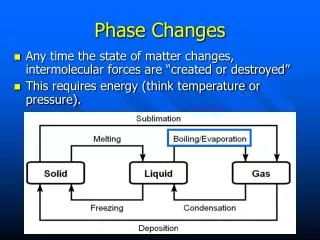
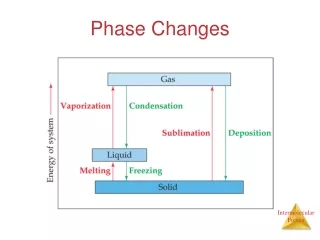
Changes of State • Vaporization • Condensation • Fusion • Solidification • Sublimation • Deposition
Heating curve • Energy can be converted into a heat change of a substance. • Energy is also required to change the state of a substance. • This change in energy is plotted in a Heating Curve.
Phase Diagrams • These are a convenient way to represent the phases of any substance as a function of temperature and pressure.
Phase Diagrams • The Triple Point is the temperature and pressure that a substance can exist as all three states of matter (solid, liquid and gas) as all three have the same vapor pressure. • The Critical Temperature is defined as the temperature above which the vapor cannot exist as a liquid no matter what pressure is applied. • The Critical Pressure is the pressure required to condense a vapor at the critical temperature. • Together the critical temperature and critical pressure make the Critical Point. • The melting point at 1 atm is the Normal Melting Point.
Application for Phase Diagrams • Note: on the phase diagram for water that the melting point of ice decreases as the external pressure increases. This is opposite to observations for most other liquids. • Why is this possible?
Phase Diagrams • For ice skating, the narrow blade exerts a large external energy on the ice melting it beneath the blade, and refreezing as the blade leaves the surface. This allows the smooth gliding action.
Phase diagrams • As pressure decreases so does the boiling point of water. This is why Doug in Caldwell, NJ requires more heat to boil water than Kristen in Boulder, CO.