Download
1 / 22
250 likes | 512 Views
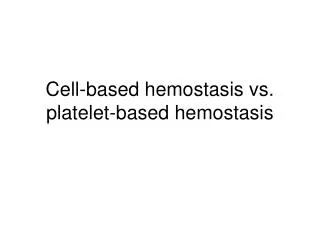
Cell-based hemostasis vs. platelet-based hemostasis. http://www.akh-wien.ac.at/biomed-research/htx/platweb1.htm. http://www.akh-wien.ac.at/biomed-research/htx/platweb1.htm. Asimetría de fosfolípidos de la membrana celular Actividad procoagulante de las plaquetas. Macrófago. Protrombina.

E N D
Asimetría de fosfolípidos de la membrana celular Actividad procoagulante de las plaquetas Macrófago Protrombina Vesícula Trombina Escramblasa Translocasa Flopasa Citoesqueleto Calpaína
Figure 1 A 2000 bp β-actin β-actin GPIba GPIba TF CD14 CD14 TF 2000 bp 600 bp C 200 bp β-actin β-actin GPIba CD14 TF TF Non-stimulated platelets TRAP-stimulated platelets B β-actin β-actin GPIba GPIba CD14 CD14 TF TF 1500 bp 600 bp Non-stimulated PBMC PBMC + TRAP 200 bp 600 bp 200 bp Non-stimulated PBMC LPS-stimulated PBMC
A A A 1 2 3 4 5 1 2 3 4 5 1 2 3 4 5 47 kDa 47 kDa 47 kDa IgG Basal 30 60 90 min min min IgG Basal 30 60 90 min min min IgG Basal 30 60 90 min min min B B B 1 2 3 4 1 2 3 4 1 2 3 4 83 kDa 83 kDa 83 kDa 64.2 kDa 64.2 kDa 64.2 kDa 47 kDa 47 kDa 47 kDa 37 kDa 37 kDa 37 kDa Basal 30 60 90 min min min Basal 30 60 90 min min min Basal 30 60 90 min min min Figure 2
A 60.4 kDa 47.2 kDa 35 kDa TRAP– –++ Puromycin – + –+ Figure 3-S
Figure 3 GPIba Merge TF 7,5 mm 7,5 mm Pearson Coeff. : 0.1855 Pearson Coeff. : 0.3188
Figure 4 Figure 4 A. Platelets B. Platelets B. Platelets 1 2 3 4 5 6 7 8 1 2 3 4 5 6 7 8 1 2 3 4 1 2 3 4 109. 5 kDa 109. 5 kDa 78.9 kDa 78.9 kDa 62.0 kDa 62.0 kDa * * 60.4 kDa 60.4 kDa 47.5 kDa 47.5 kDa 47.2 kDa 47.2 kDa 35.1 kDa 35.1 kDa 32.5 kDa 32.5 kDa 24.9 kDa 24.9 kDa TRAP– + – + – + – + Tunicamycin– – + + – – + + Puromycin – – – – + + – – TRAP– + – + – + – + Tunicamycin– – + + – – + + Puromycin – – – – + + – – TRAP – – + + Puromycin– + – + TRAP – – + + Puromycin– + – + C. PBMC suspensions 1 2 3 4 5 6 1 2 3 4 5 6 109.5 kDa 109.5 kDa 78.9 kDa 78.9 kDa 60.4 kDa 60.4 kDa 47.2 kDa 47.2 kDa 35.1 kDa 35.1 kDa 24.9 kDa 24.9 kDa LPS – + + – + + Puromycin – + – – – + LPS – + + – + + Puromycin – + – – – +
Figure 4S 1 2 3 4 62.0 kDa 47.5 kDa 32.5 kDa LPS++ + + Actinomycin D –+ – – DRB – –+– Puromycin – ––+
Figure 5 Vis Hoechst 3 m Merge TF GPIbα
Figure 5-S Vis GPIba TF TF GPIbα GPIba TF Merge Merge TF GPIbα
Figure 6 TF GPIbα Merge 6 μM TF TF GPIbα GPIbα GPIba TF Merge Merge Merge
Regular Manuscript Human platelets synthesize and express functional tissue factor. Olga Panes1, Valeria Matus1, Claudia G. Sáez1, Teresa Quiroga2, Jaime Pereira1, Diego Mezzano1. From the Departments of Hematology-Oncology1, and Clinical Laboratory2, School of Medicine, Pontificia Universidad Católica de Chile, Santiago, Chile. Supported by Grants 8010002 (D.M., J.P., T.Q.) and 1060637 (D.M.) from Fondecyt, Chile. (Blood, 2007, en prensa)