
Uploaded by
etenia
8 SLIDES
284 VIEWS
100LIKES
GRAPHING BASICS
DESCRIPTION
GRAPHING BASICS. Three Types of Graphs : LINE GRAPH BAR GRAPH CIRCLE GRAPH. LINE GRAPHS. LINE GRAPH S – show a change over time. Ex: a change in temperature over a period of 20 minutes. Line. Time. BAR GRAPHS. Bar Graphs – show comparisons
Download
1 / 8
Download Presentation 
GRAPHING BASICS
An Image/Link below is provided (as is) to download presentation
Download Policy: Content on the Website is provided to you AS IS for your information and personal use and may not be sold / licensed / shared on other websites without getting consent from its author.
Content is provided to you AS IS for your information and personal use only.
Download presentation by click this link.
While downloading, if for some reason you are not able to download a presentation, the publisher may have deleted the file from their server.
During download, if you can't get a presentation, the file might be deleted by the publisher.
E N D
Presentation Transcript
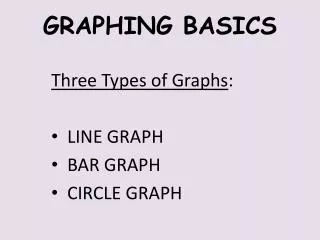
GRAPHING BASICS Three Types of Graphs: LINE GRAPH BAR GRAPH CIRCLE GRAPH
LINE GRAPHS LINE GRAPH S – show a change over time. Ex: a change in temperature over a period of 20 minutes Line Time
BAR GRAPHS Bar Graphs – show comparisons EX: Comparing # Democrats to # of Republicans in state of Texas B AR RE COMP
Circle Graphs Circle Graphs-show parts of a whole EX: Types of Music Liked Most at Manvel JHS


More Related