Download
1 / 43
430 likes | 555 Views
V3 From Protein Complexes to Networks and back. Protein networks could be defined in a number of ways (1) Co-regulated expression of genes/proteins (2) Proteins participating in the same metabolic pathways (3) Proteins sharing substrates (4) Proteins that are co-localized

E N D
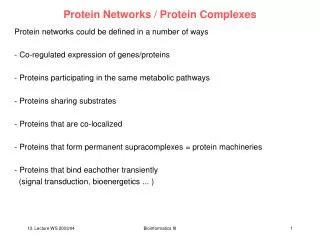
V3 From Protein Complexes to Networks and back • Protein networks could be defined in a number of ways • (1) Co-regulated expression of genes/proteins • (2) Proteins participating in the same metabolic pathways • (3) Proteins sharing substrates • (4) Proteins that are co-localized • (5) Proteins that form permanent supracomplexes = „protein machines“ • (6) Proteins that bind each other transiently • (signal transduction, bioenergetics ... ) • In V4 we will look at computational methods to predict protein-protein interactions. • Today, we will look at permanent and transient protein complexes. Bioinformatics III
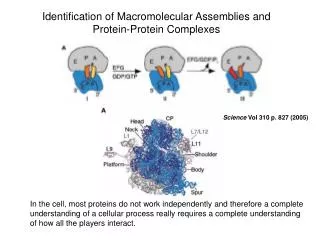
Methods for the structural characterization of macromolecular assemblies (a) Electron diffraction map and 3D X-ray protein structure. X-ray provides atomic-resolution structures. (b) 3D protein structure and plot showing chemical shifts determined by NMR. NMR spectroscopy extracts distances between atoms by measuring transitions between different nuclear spin states within a magnetic field. These distances are then used as restraints to build 3D structures. NMR spectroscopy also provides atomic-resolution structures, but is generally limited to proteins of about 300 residues. It plays an increasingly important role in studying interaction interfaces between structures determined independently. (c) EM micrograph and 3D reconstruction of a virus capsid. EM is based on the analysis of images of stained particles. Different views and conformations of the complexes are trapped and thus thousands of images have to be averaged to reconstruct the three-dimensional structure. Classical implementations were limited to a resolution of 20 Å. More recently, single-particle cryo techniques, whereby samples are fast frozen before study, have reached resolutions as high as approximately 6 Å. EM provides information about the overall shape and symmetry of macromolecules. (d) Slice images and rendered surface of a ribosome-decorated portion of endoplasmic reticulum. In electron tomography, the specimen studied is progressively tilted upon an axis perpendicular to the electron beam. A set of projection images is then recorded and used to build a 3D model. This technique can tackle large organelles or even complete cells without perturbing their physiological environment. It provides shape information at resolutions of approximately 30 Å. (e) Yeast two-hybrid array screen and small network of interacting proteins. Interaction discovery comprises many different methods whose objective is to determine spatial proximity between proteins. These include techniques such as the two-hybrid system, affinity purification, FRET, chemical cross-linking, footprinting and protein arrays. These methods provide very limited structural information and no molecular details. Their strength is that they often give a quasi-comprehensive list of protein interactions and the networks they form. Russell et al. Curr. Opin. Struct. Biol. 14, 313 (2004) Bioinformatics III
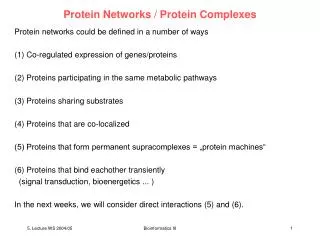
Hybrid models: docking X-ray structures into EM maps Hybrid assembly of the 80S ribosome from yeast. (a) Superposition of a comparative protein structure model (red) of a domain from ribosomal protein L2 from Bacillus stearothermophilus with the actual structure (blue) (PDB code 1RL2). (b) A partial molecular model of the whole yeast ribosome calculated by fitting atomic rRNA (not shown) and comparative protein structure models (ribbon representation) into the electron density of the 80S ribosomal particle. Russell et al. Curr. Opin. Struct. Biol. 14, 313 (2004) Bioinformatics III
Putative structure through modeling and low-resolution EM (a) Exosome subunits. The top of the panel shows the domain organization of two subunits present in the complex, but lacking any detectable similarity to known 3D structures. The model for the nine other subunits (bottom) was constructed by predicting binary interactions using InterPReTS and building models based on a homologous complex structure using comparative modeling. (b) EM density map (green mesh) with the best fit of the model shown as a gray surface and the predicted locations of the subunits labeled. The question marks indicate those subunits for which no structures could be modeled. Russell et al. Curr. Opin. Struct. Biol. 14, 313 (2004) Bioinformatics III
Potential errors in biochemical interaction discovery (a) Indirect interactions between cyclin-dependent kinase regulatory subunit (CKS) and cyclin A detected by the Y2H system. Several interactions between CKS domains and cyclins were reported in genome-scale two-hybrid studies. However, analysis of 3D structures suggests that the endogenous cyclin-dependent kinase 2 (CDK2) probably mediates the interaction, as combining the CDK2–CKS and CDK2–cyclin A structures places the CKS and cyclin domains 18 Å apart. (b) An example of an interaction that is not detected by any screen, possibly because molecular labels (e.g. affinity purification tags, or two-hybrid DNA binding or activation domains) are interfering with the interaction. The X-ray structure of the actin–profilin complex reveals that the actin C terminus (C-t) lies at the interaction interface (the other N and C termini are also labeled). Russell et al. Curr. Opin. Struct. Biol. 14, 313 (2004) Bioinformatics III
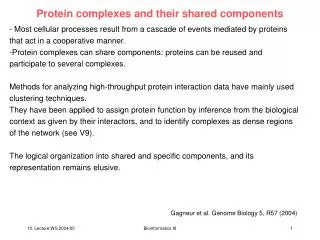
1 Protein-Protein Complexes It has been realized for quite some time that cells don‘t work by random diffusion of proteins, but require a delicate structural organization into large protein complexes. Which complexes do we know? Bioinformatics III
RNA Polymerase II RNA polymerase II is the central enzyme of gene expression and synthesizes all messenger RNA in eukaryotes. Cramer et al., Science 288, 640 (2000) Bioinformatics III
RNA processing: splicesome Structure of a cellular editor that "cuts and pastes" the first draft of RNA straight after it is formed from its DNA template. It has two distinct, unequal halves surrounding a tunnel. The larger part appears to contain proteins and the short segments of RNA, while the smaller half is made up of proteins alone. On one side, the tunnel opens up into a cavity, which the researchers think functions as a holding space for the fragile RNA waiting to be processed in the tunnel itself. Profs. Ruth and Joseph Sperling http://www.weizmann.ac.il/ Bioinformatics III
Protein synthesis: ribosome The ribosome is a complex subcellular particle composed of protein and RNA. It is the site of protein synthesis, http://www.millerandlevine.com/chapter/12/cryo-em.html Model of a ribosome with a newly manufactured protein (multicolored beads) exiting on the right. Bioinformatics III
Signal recognition particle Cotranslational translocation of proteins across or into membranes is a vital process in all kingdoms of life. It requires that the translating ribosome be targeted to the membrane by the signal recognition particle (SRP), an evolutionarily conserved ribonucleoprotein particle. SRP recognizes signal sequences of nascent protein chains emerging from the ribosome. Subsequent binding of SRP leads to a pause in peptide elongation and to the ribosome docking to the membrane-bound SRP receptor. SRP shows 3 main activities in the process of cotranslational targeting: first, it binds to signal sequences emerging from the translating ribosome; second, it pauses peptide elongation; and third, it promotes protein translocation by docking to the membrane-bound SRP receptor and transferring the ribosome nascent chain complex (RNC) to the protein-conducting channel. 40S small ribosomal subunit (yellow) 60S large ribosomal subunit (blue), P-site tRNA (green), SRP (red). Halic et al. Nature 427, 808 (2004) Bioinformatics III
Nuclear Pore Complex A three-dimensional image of the nuclear pore complex (NPC), revealed by electron microscopy. A-B The NPC in yeast. Figure A shows the NPC seen from the cytoplasm while figure B displays a side view. C-D The NPC in vertebrate (Xenopus). http://www.nobel.se/medicine/educational/dna/a/transport/ncp_em1.html Three-Dimensional Architecture of the Isolated Yeast Nuclear Pore Complex: Functional and Evolutionary Implications, Qing Yang, Michael P. Rout and Christopher W. Akey. Molecular Cell, 1:223-234, 1998 NPC is a 50-100 MDa protein assembly that regulates and controls trafficking of macromolecules through the nuclear envelope. Bioinformatics III
GroEL: a chaperone to assist misfolded proteins Schematic Diagram of GroEL Functional States (a) Nonnative polypeptide substrate (wavy black line) binds to an open GroEL ring. (b) ATP binding to GroEL alters its conformation, weakens the binding of substrate, and permits the binding of GroES to the ATP-bound ring. (c) The substrate is released from its binding sites and trapped inside the cavity formed by GroES binding. (d) Following encapsulation, the substrate folds in the cavity and ATP is hydrolysed. (e) After hydrolysis in the upper, GroES-bound ring, ATP and a second nonnative polypeptide bind to the lower ring, discharging ligands from the upper ring and initiating new GroES binding to the lower ring (f) to form a new folding active complex on the lower ring and complete the cycle. http://people.cryst.bbk.ac.uk/~ubcg16z/chaperone.html Ransom et al., Cell 107, 869 (2001) Bioinformatics III
Arp2/3 complex The seven-subunit Arp2/3 complex choreographs the formation of branched actin networks at the leading edge of migrating cells. (A) Model of actin filament branches mediated by Acanthamoeba Arp2/3 complex.(D) Density representations of the models of actin-bound (green) and the free, WA-activated (as shown in Fig. 1D, gray) Arp2/3 complex. Volkmann et al., Science 293, 2456 (2001) Bioinformatics III
proteasome The proteasome is the central enzyme of non-lysosomal proteindegradation. It is involved in the degradation of misfolded proteins as well as in the degradation and processing of short lived regulatory proteins.The 20S Proteasome degrades completely unfoleded proteins into peptides with a narrow length distribution of 7 to 13 amino acids. http://www.biochem.mpg.de/xray/projects/hubome/images/rpr.gif Löwe, J., Stock, D., Jap, B., Zwickl, P., Baumeister, W. and Huber, R. (1995). Crystal structure of the 20S proteasome from the archaeon T. acidophilum at 3.4 Å resolution. Science268, 533-539. Bioinformatics III
Energy conversion: Photosynthetic Unit • Other large complexes: • - Apoptosome • Thermosome • Transcriptome Structure suggested by force field based molecular docking. http://www.ks.uiuc.edu/Research/vmd/gallery Bioinformatics III
icosahedral pyruvate dehydrogenase complex: a multifunctional catalytic machine Model for active-site coupling in the E1E2 complex. 3 E1 tetramers (purple) are shown located above the corresponding trimer of E2 catalytic domains in the icosahedral core. Three full-length E2 molecules are shown, colored red, green and yellow. The lipoyl domain of each E2 molecule shuttles between the active sites of E1 and those of E2. The lipoyl domain of the red E2 is shown attached to an E1 active site. The yellow and green lipoyl domains of the other E2 molecules are shown in intermediate positions in the annular region between the core and the outer E1 layer. Selected E1 and E2 active sites are shown as white ovals, although the lipoyl domain can reach additional sites in the complex. Milne et al., EMBO J. 21, 5587 (2002) Bioinformatics III
Apoptosome (A) Top view of the apoptosome along the 7-fold symmetry axis. (B) Details of the spoke. (C) A side view of the apoptosome reveals the unusual axial ratio of this particle. The scale bar is 100 Å. (D) An oblique bottom view shows the puckered shape of the particle. The arms are bent at an elbow (see asterisk) located proximal to the hub. Acehan et al. Mol. Cell 9, 423 (2002) Apoptosis is the dominant form of programmed cell death during embryonic development and normal tissue turnover. In addition, apoptosis is upregulated in diseases such as AIDS, and neurodegenerative disorders, while it is downregulated in certain cancers. In apoptosis, death signals are transduced by biochemical pathways to activate caspases, a group of proteases that utilize cysteine at their active sites to cleave specific proteins at aspartate residues. The proteolysis of these critical proteins then initiates cellular events that include chromatin degradation into nucleosomes and organelle destruction. These steps prepare apoptotic cells for phagocytosis and result in the efficient recycling of biochemical resources. In many cases, apoptotic signals are transmitted to mitochondria, which act as integrators of cell death because both effector and regulatory molecules converge at this organelle. Apoptosis mediated by mitochondria requires the release of cytochrome c into the cytosol through a process that may involve the formation of specific pores or rupture of the outer membrane. Cytochrome c binds to Apaf-1 and in the presence of dATP/ATP promotes assembly of the apoptosome. This large protein complex then binds and activates procaspase-9. Bioinformatics III
Future? • Structural genomics (X-ray) may soon generate enough templates of individal folds. • Structural genomics may be expanded to protein complexes. • Interactions between proteins of the same fold tend to be similar when the sequence identity is above approximately 30% (Aloy et al.). • Hybrid modelling of X-ray/EM will not be able to answer all questions • problem of induced fit • transient complexes cannot be addressed by these techniques • Essential to combine large variety of hybrid + complementary methods • Russell et al. Curr. Opin. Struct. Biol. 14, 313 (2004) Bioinformatics III
2 Information on protein-protein networks Bioinformatics III
2. Yeast 2-Hybrid Screen Data on protein-protein interactions from Yeast 2-Hybrid Screen. One role of bioinformatics is to sort the data. Bioinformatics III
Protein cluster in yeast Cluster-algorithm generates one large cluster for proteins interacting with each other based on binding data of yeast proteins. Schwikowski, Uetz, Fields, Nature Biotech. 18, 1257 (2001) Bioinformatics III
Annotation of function After functional annotation: connect clusters of interacting proteins. Schwikowski, Uetz, Fields, Nature Biotech. 18, 1257 (2001) Bioinformatics III
Annotation of localization Schwikowski, Uetz, Fields, Nature Biotech. 18, 1257 (2001) Bioinformatics III
3 Systematic identification of protein complexes Bioinformatics III
Systematic identication of large protein complexes Yeast 2-Hybrid-method can only identify binary complexes. Cellzome company: attach additional protein P to particular protein Pi , P binds to matrix of purification column. yieldsPi and proteins Pk bound to Pi . Identify proteins by mass spectro- metry (MALDI- TOF). Gavin et al. Nature 415, 141 (2002) Bioinformatics III
Analyis of protein complexes in yeast (S. cerevisae) Identify proteins by scanning yeast protein database for protein composed of fragments of suitable mass. Here, the identified proteins are listed according to their localization (a). (b) lists the number of proteins per complex. Gavin et al. Nature 415, 141 (2002) Bioinformatics III
Validation of methodology Check of the method: can the same complex be obtained for different choice of attachment point (tag protein attached to different coponents of complex)? Yes (see gel). Method allows to identify components of complex, not the binding interfaces. Better for identification of interfaces: Yeast 2-hybrid screen (binary interactions). 3D models of complexes are important to develop inhibitors. • theoretical methods (docking) • electron tomography Gavin et al. Nature 415, 141 (2002) Bioinformatics III
Analysis of affinity-purified protein complexes in E.coli TAP-purification for 25% of the E.coli genome, targeting 1000 ORFs. 857 tagged proteins, including 198 essential and conserved proteins 648 could be purified. Out of these, 118 had no detectable partners. 530 other „baits“ : 5254 protein-protein interactions. Verification by reciprocal tagging of many candidate partners: 53% validation rate (716 non-redundant validated interactions). 85% of the validated interactions are new! Not described in the Database of Interacting Proteins (DIP), Biomolecular Interaction Network Database (BIND), and other databases. Butland et al. Nature 433, 531 (2005) Bioinformatics III
Pilot purification of DNA-dependent RNA polymerase SDS–PAGE silver-stain analysis of the components of affinity-purified complexes from E. coli. a–c, Purification of TAP-tagged E. coli RNAP subunit b (a) and two associated proteins: SPA-tagged b1731 (b) and TAP-tagged YacL (c). a Tagged core subunit of RNA polymerase (RpoB) co-purified specifically with essential elongation factors (NusA and NusG), specified sigma factors involved in promoter recognition (RpoH, RpoS, RpoD) and with accessory factors (RpoZ, HepA and YacL). Similarly, NusG was co-purified with YacL, HepA, core enzyme and termination factor Rho, whereas RpoZ bound RpoD, NusA and b1731 (sofar unknown). b reciprocal experiment: tagged b1731 co-purified with , RpoC, RpoA, RpoD and RpoZ, but not with Nus factors, HepA or YacL. probably b1731 exclusively binds to , suggesting an exclusive association with initiating holoenzyme. c However, tagged YacL bound RpoZ, NusG and HepA together with core enzymes, suggesting a role in elongation. Butland et al. Nature 433, 531 (2005) Bioinformatics III
Network properties of bacterial protein-protein interactions Network of validated protein complexes. Interactions are represented as directional edges extending from the tagged protein. Baits without partners are removed for clarity. Red nodes, essential proteins; blue nodes, non-essential proteins; black ovals, complexes discussed in text. Butland et al. Nature 433, 531 (2005) Bioinformatics III
Significance of novel interactions? Check functional annotation E.g., acyl carrier protein (ACP), a key carrier of growing fatty acid chains, bound specifically and reproducibly to enzymes linked to biogenesis of fatty acids, phospholipids and lipid A (essential outer-membrane constituent), including - two 3-ketoacyl-ACP synthases (FabB, FabF) - 3-ketoacyl-ACP reductase (FabG), - 3-hydroxyacyl-ACP dehydrase (FabZ), - LpxD (essential protein required for lipid A biogenesis), - YbgC (tol-pal cluster hydrolase of short-chain acyl-CoA thioesters), - AcpS (involved in transfer of 4‘ - phosphopantethein to ACP), - Aas and PlsB (membrane proteins involved in phospholipid acylation), and - YiiD (putative acetyltransferase). ACP also co-purified with GlmU (an essential bi-functional enzyme that converts glucosamine-1-phosphate to UDP-GlcNAc (lipid A precursor)), AidB (isovaleryl-CoA dehydrogenase), SecA (pre-protein translocase), as well as MukB and SpoT. Butland et al. Nature 433, 531 (2005) Bioinformatics III
Network properties of bacterial protein-protein interactions Connectivity distribution of validated interactions (K) per protein plotted as a function of frequency, P(k). Inset: log-plot power law distribution, P(k) < k-, where is the degree exponent. evidence of „scale-free behavior“ Comparable connectivity observed for the essential-conserved proteins alone. Butland et al. Nature 433, 531 (2005) Bioinformatics III
Interaction network connectivity and robustness Node shading (white to black) is scaled according to the increasing number of genomes in which a putative interaction is detected based on gene co-occurrence. a, Interaction network after attacking the 20 most highly connected, highly conserved (detected by BLAST in >= 125 genomes) hubs. b, Network before attack (See Fig 3c). removal of 20 hubs markedly reduced network connectivity. Butland et al. Nature 433, 531 (2005) Bioinformatics III
Interaction network connectivity and robustness c Connectivity properties of the conserved (blue color; detected by BLAST in >= 125 genomes) and non conserved (purple color; <= 25 genomes)proteins. x-axis: number of connections per protein y-axis: frequency of proteins belonging to this group. Inset: mean of random sets of interacting proteins (Control) of the same size as the datasets. d, x-axis: number of interactions per protein y-axis: number of genomes a homolog was detected in (BLAST score ≥ 50). Hubs are all conserved! Protein connectivity is proportional to the number of homologous in other genomes Butland et al. Nature 433, 531 (2005) Bioinformatics III
Network properties of bacterial protein-protein interactions Network of highly conserved proteins co-occurring in ≥125 genomes (homologue raw BLAST bit score ≥50). The most highly conserved proteins are highly connected, forming a single interconnected component. This core set of interactions (including the ribosome) potentially fulfils critical roles across all bacteria. Butland et al. Nature 433, 531 (2005) Bioinformatics III
Bioinformatic analyses of interacting protein modules a Node shading (white to black) is scaled according to the increasing number of genomes in which a putative interaction is detected based on gene co-occurrence using COGs genomes. Similar results as for the highly conserved proteins. b, Interaction network for proteins with clear co-occurrence (in ≥ 40 genomes). Proteins with no interacting partner have been removed for clarity. Butland et al. Nature 433, 531 (2005) Bioinformatics III
4 Aim: generate structures of protein complexes • Experiment • Start from 232 purified complexes from TAP strategy. • Select 102 that gave samples most promising for EM from analysis of gels and protein concentrations. • Take EM images. • Theory • Make list of components. • Assign known structures of individual proteins. • Assign templates of complexes • If complex structure available for this pair • if complex structure available for homologous protein • if complex structure available for structurally similar protein (SCOP) Bettina Böttcher (EM) Rob Russell (Bioinformatics) Bioinformatics III
How transferable are interactions? interaction similariy (iRMSD) vs. % sequence identity for all the available pairs of interacting domains with known 3D structure. Curve shows 80% percentile (i.e. 80% of the data lies below the curve), and points below the line (iRMSD = 10 Å) are similar in interaction. Aloy et al. Science, 303, 2026 (2004) Bioinformatics III
Bioinformatics Strategy Illustration of the methods and concepts used. How predictions are made within complexes (circles) and between them (cross-talk). Bottom right shows two binary interactions combined into a three-component model Aloy et al. Science, 303, 2026 (2004) Bioinformatics III
3SOM algorithm: vector-based circumference superimposition A 2D variant of the 3D vector-based surface superimposition that is central to the 3SOM algorithm. For each tested voxel a on the circumference of the target, a vector va is calculated that approximates the normal vector orthogonal to the tangent line in a and with origin in a. Vector va is superimposed on each vector vb that is associated with a voxel b on the circumference of the template. The goodness-of-fit of the transformation in question is assessed by measuring the circumference overlap, the fraction of target circumference voxels that is projected onto (or near) the template circumference (triangles). In 3D, a rotational degree of freedom is left around the superimposed vectors, which is sampled in rotational steps of 9°. Ceulemans, Russell J. Mol. Biol., 338, 783 (2004) Bioinformatics III
Successful models of yeast complexes (A) Exosome model on PNPase fit into EM map. (B) RNA polymerase II with RPB4 (green)/RPB7 (red) built on Methanococcus jannaschii equivalents, and SPT5/pol II (cyan) built with IF5A. (C and D) Views of CCT (gold) and phosphoducin 2/VID27 (red) fit into EM map. (E) Micrograph of POP complex, with particle types highlighted. (F) Ski complex built by combination of two complexes. Aloy et al. Science, 303, 2026 (2004) Bioinformatics III
Cross talk between complexes (Top) Triangles show components with at least one modelable structure and interaction; squares, structure only; circles, others. Lines show predicted interactions: thick lines imply a conserved interaction interface; red, those supported by experiment. (Bottom) Expanded view of cross-talk between transcription complexes built on by a combination of two complexes. Aloy et al. Science, 303, 2026 (2004) Bioinformatics III
Summary A combination of 3D structure and protein-interaction data can already provide a partial view of complex cellular structures. The structure-based network derived from cross-talk between complexes provides a more realistic picture than those derived blindly from interaction data, because it suggests molecular details for how they are mediated. Of course, the picture is still far from complete and there are numerous new challenges. The structure-based network derived here provides a useful initial framework for further studies. Its beauty is that the whole is greater than the sum of its parts: Each new structure can help to understand multiple interactions. The complex predictions and the associated network will thus improve exponentially as the numbers of structures and interactions increase, providing an ever more complete molecular anatomy of the cell. Aloy et al. Science, 303, 2026 (2004) Bioinformatics III