Download
1 / 25
250 likes | 445 Views
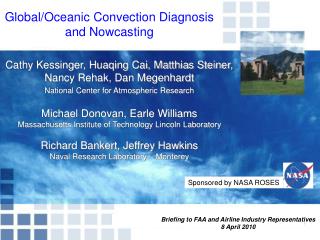
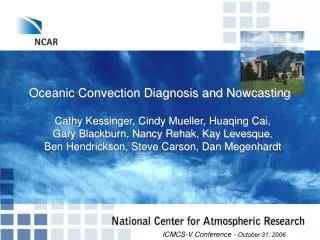
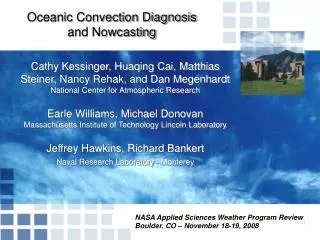
Oceanic Convection Diagnosis and Nowcasting. Cathy Kessinger, Huaqing Cai, Matthias Steiner, Nancy Rehak, and Dan Megenhardt National Center for Atmospheric Research Earle Williams, Michael Donovan Massachusetts Institute of Technology Lincoln Laboratory Jeffrey Hawkins, Richard Bankert

E N D
Oceanic Convection Diagnosis and Nowcasting Cathy Kessinger, Huaqing Cai, Matthias Steiner, Nancy Rehak, and Dan Megenhardt National Center for Atmospheric Research Earle Williams, Michael Donovan Massachusetts Institute of Technology Lincoln Laboratory Jeffrey Hawkins, Richard Bankert Naval Research Laboratory - Monterey NASA Applied Sciences Weather Program Review Boulder, CO – November 18-19, 2008
FAA Predictions for International Air Travel • Total passenger traffic between the U.S.A and the world is estimated at 147.1 million in CY 2007, 2.9% higher than 2006 • 2010-2025, average annual U.S. and world economic growth, projected to lead to international passenger growth averaging 4.5% per year, totaling 331.5 million in 2025 • Growth in international air traffic suggests a greater need for oceanic aviation weather products
SIGMETs – 4 hr updates SIGMETs – 6 hr updates Significant Wx Chart 6 hr updates Full disk – 3 hr updates Current Products for International/Oceanic Aviation • International Flight Folder on NWS Aviation Weather Center web site contains: • International SIGMETs • Significant Weather (SigWx) prognostic chart • Hurricane and tropical storm SIGMETs • Infrared satellite imagery (black and white; color) Our project goal is to create higher resolution (time and space) convective weather products for the oceanic aviation community that are in alignment with the NextGen 4-D Data Cube
Oceanic Convection Program • Funding history: • 3 year ROSES grant, Feb 2007-2010 • 1 year Cooperative Agreement Notice, March 2006-2007 • FAA AWRP Oceanic Weather PDT 2001-2006 • Convective Diagnosis Oceanic (CDO) • GOES-based methodology for determining the locations of deep convective clouds • Convective Nowcasting Oceanic (CNO) • Nowcasting system for 1-hr and 2-hr predictions of convection location • Subset of this effort will be technology-transferred to the ROSES Global Turbulence effort
CldClass Daytime: 15 Categories Nighttime: 10 Categories Convective Diagnosis Oceanic (CDO) Thresholded, Binary Product Convective Diagnosis Oceanic (CDO) Interest Field (0-4 daytime, 0-3 nighttime) CDO interest = 2.5 defines convection Convective Diagnosis Oceanic (CDO) • GOES-based detection of convection • Fuzzy logic, data fusion of 3 algorithms: • CTOP: NRL Cloud Top Height (Smith) • CldClass: NRL Cloud Classification (Tag, Bankert) • GCD: AWC Global Convective Diagnosis (Mosher) CTOP GCD
Convective Nowcast Oceanic (CNO) • Current methodology • Extrapolation of CDO product using an object tracker • Thunderstorm Initiation, Tracking and Nowcasting (TITAN) • 1-hr and 2-hr nowcasts of convection location • Does not provide initiation nowcasts IR BT 1hr CNO (red polygons) 2hr CNO (brown polygons)
IR 5 km PR CAPPI TRMMHAZARD CDO Interest TRMM Validation of the CDO Interest • Validation important to optimize and tune algorithms for best performance and to measure performance • Remote, oceanic regions are a validation challenge • Few instruments • Independent measurements best • Low earth orbit satellites provide means • Tropical Rainfall Measuring Mission (TRMM) • VIRS • Precipitation Radar (PR) • Lightning Imaging Sensor (LIS) • Convective rainfall product T=Convective rain Z=>30 dBZ at 5km L=Lightning • Previously, 3 intercomparisons completed for component algs • FAA AWRP funding Donovan et al., (2008)
Validation Selection Process • Match geostationary CDO interest with TRMM • Within 15 minutes (more stringent than earlier intercomparisons) • Within TRMM PR swath • Some adjustments made for advection, due to temporal offsets Define convective cell with TRMM VIRS • IR BT <-30 deg C for >6 grid points (area 216 km2) (~31kft using 6.5 deg C MALR) Rules: • Radar reflectivity >30 dBZ at 5 km altitude (MSL) and in lower portion of the mixed phase region • >1 lightning flash within cell • TRMM precipitation algorithm classifies rainfall as ‘convective certain’ where IR BT <-3degC
Identify Hazardous Convective Cells Rules: • Radar reflectivity >30 dBZ at 5 km altitude (MSL) and in lower portion of the mixed phase region • >1 lightning flash within cell • TRMM precipitation algorithm classifies rainfall as ‘convective certain’ where IR BT <-3degC • Threshold 1) or 2) exceeded: cell is hazardous • If threshold 3) is lone indicator of hazard, cell flagged as hazardous only if >5 grid bins of convective rain (180 km2 area) present • Manual matching of CDO interest value to TRMM products for evaluation • ~1800 cells were analyzed between 12-18 August 2007
Hit False Alarm Correct Negative Correct Negative Hit d) CDO Interest Example of Methodology for CDO Interest Validation • Manual scoring of each storm done to fill a 2x2 contingency table T=Convective rain Z=>30 dBZ at 5km L=Lightning
CDO Interest Field Verification Results • Statistical performance separated by various categories
Relative Operating Characteristic (ROC) 2.0 Maximum Skill Bias Probability Score 1.0 Probability of Detection (POD) POD Accuracy CSI FAR Minimum Skill 2.5 Interest Threshold False Alarm Rate (POFD) CDO Performance Metrics • CDO interest threshold of 2.5 provides best performance
Reflectivity T=Convective rain Z=>30 dBZ at 5km L=Lightning Hurricane Dean • CDO interest follows the structure of Hurricane Dean, • Reflectivity >35 dBZ defined as convection by CDO (>2.5) • The eyewall is also depicted (CDO <1.5)
Summary of TRMM Validation of CDO Interest • CDO interest more skillful at identifying convection than the three component algorithms • POD: 72%, FAR: 26%, CSI: 58% • Interest threshold of 2.5 produces best performance with least bias • CDO interest values typically highest near cloud center and/or in regions of coldest cloud top temperatures • Not necessarily regions of greatest hazard as seen by TRMM • Oceanic cumulonimbus clouds frequently attain high altitude (>40 kft) but lack a strong updraft (and attendant radar reflectivity aloft and lightning) • However, turbulence can be associated with overshooting tops and along the edge of the anvil
IR 1hr CNO 2hr CNO Validation of Current CNO Methodology • Validate CNO nowcasts using CDO interest >2.0 • Gridpoint-to-gridpoint calculations • Hurricane Dean period from 12-22 August 2007
1-hr 2-hr 3-hr 0615 Z 2015 Z CDO Binary Product CDO Binary Product CSI Scores for 1-hr, 2-hr, 3-hr CNO • 1-hr extrapolation performs best • Diurnal cycle evident in CSI curves • For these days, nighttime CSI scores higher than daytime • Numerous small storms during afternoon • At night, fewer and larger storms 12 August 2007 13 August 2007 Night Day
CNO Preliminary Performance Results • Covers 12-22 August 2007 • CSI and bias decrease as nowcast lead time increases • Statistical analysis procedures not yet finalized
Using Random Forest for CNO • Random Forest is: • Non-linear statistical analysis technique • A collection of decision trees from a “training set” of predictor variables and associated “truth” values • Trees function as an “ensemble of experts” and vote on the classification for each new data point • Final classification is the consensus “winner” • Why use Random Forest for CNO? • Allows easier evaluation of environmental, climatological and numerical model products to judge their usefulness within nowcasting system • FAA CoSPA product also using this technique to screen indicators image from http://www.irb.hr
Mdv to ARFF Thin the ARFF Train the RF Classification CNO – Random Forest Methodology • Subset of predictor fields used to train a random forest • Existing convection was the feature of interest • All predictor fields advected to position at 1-hr nowcast time • 200 trees used • Predictor fields used for initial experiments: • GOES satellite imagery • CDO interest and input algorithms (CTOP, CldClass, GCD) • NCEP Global Forecast System (GFS) numerical model • Frontal likelihood, stability analysis, CAPE/CIN • Random Forest trained on data from 12-18 August 2007 during Hurricane Dean • Trained Random Forest ran on data from 19-22 August to test results
Importance Ranking of Input Variables • Importance ranking reveals which predictor fields have most value in making the correct nowcast • Satellite data/products rank highest 8 of 18
CDO=4 Votes per CDO Interest Value CDO=0 CDO=2 CDO=1 CDO=3
1 hr CDO Interest Forecast CDO Interest Verification An Example of 1 hr RF Nowcast for CNO Hurricane Dean 19 August 2007
Random Forest Next Steps • Add more predictor fields: • Sea surface temperature (Aqua AMSR-E) • Near-surface winds (QuikSCAT scatterometer) • Shows near-surface convergence • Sounder: Temperature/moisture vertical profiles (Aqua AMSU/AIRS) • Stability analysis, CAPE/CIN • Cloud top cooling rates • Total Precipitable Water field • Lightning climatology (TRMM) • Test on more cases • Validation using TRMM – similar as done for CDO interest
Other FY08 Accomplishments • Added North Atlantic Cloud Top Height to project web site: http://www.rap.ucar.edu/projects/ocn • Merger of Cloud Motion Vectors w/ GFS for extrapolation • Initial study on environmental characteristics during storm initiation • Comparison of Cloud Classifier to another cloud typing algorithm that used “explicit physics” • Removed Terascan dependency for Cloud Class • Code deployed within AutoNowcaster for the NWS/CWSU • Study on impact of African dust on convective suppression in Gulf of Mexico completed
Outlook for Year 3 • Expand into Pacific domain with CDO/CNO • Tested Cloud Classifier with MTSAT-1R • Refine CDO based on TRMM validation • Day/night performance differences • Validation of CNO w/TRMM • Complete Random Forest testing and validation • Evaluation of Cloud Motion Vectors w/ GFS for extrapolation • Finish study on environmental characteristics during storm initiation • Continue study on impact of African dust on convective suppression in Gulf of Mexico • Complete the Benchmark/Summary of Research report