Download
1 / 19
190 likes | 337 Views
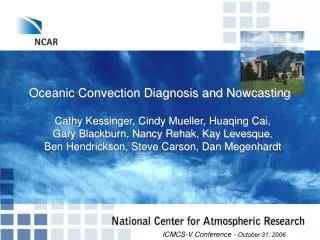
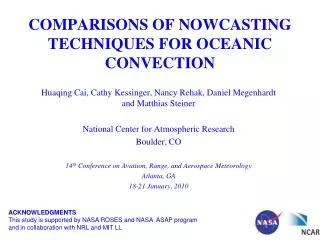
The Challenges of Nowcasting Convection over the Ocean. Huaqing Cai, Cathy Kessinger, Nancy Rehak, Daniel Megenhardt and Matthias Steiner National Center for Atmospheric Research Boulder, CO, USA Joint 2010 CWB weather Analysis and Forecasting and

E N D
The Challenges of Nowcasting Convection over the Ocean Huaqing Cai, Cathy Kessinger, Nancy Rehak, Daniel Megenhardt and Matthias Steiner National Center for Atmospheric Research Boulder, CO, USA Joint 2010 CWB weather Analysis and Forecasting and COAA 5th International Ocean-Atmosphere Conference 28-30 June, 2010 Central Weather Bureau, Taipei ACKNOWLEDGMENTS This study is supported by NASA ROSES and NASA ASAP program and in collaboration with NRL and MIT LL
Air France 447 (0145 UTC 1 June 2009) The wide-area view provided by real-time experimental Global Convection/Turbulence uplinks may have improved pilot situational awareness Motivation: Air France 447 Longwave IR (0145 UTC) Convection Diagnosis Oceanic (CDO) 0145 UTC (approx.) Last ACARS message, 0214 UTC + (approx.) Last verbal contact, 0133 UTC Cloud Top Height (0145 UTC) (approx.) Last ACARS message, 0214 UTC + (approx.) Last verbal contact, 0133 UTC
“Wx Ahead” Uplink Message valid 0130 UTC 1 June 2009 /EXP CLOUD TOP FI AF447/AN NXXXAF 01 Jun 09 -- '/' Cloud tops 30,000 to 40,000 ft//////CCC///// 'C' Cloud tops above 40,000 ft///////////CC///// *4.0N,30.0W///////// *////////C////////// //*//CC///CCC///////// ///*CCCC/C/CC////////// ////*CCCCCCC//C///////// ///CC*CCCCC///CC//////// ///CCC*CCCCC///////////// //CCCCC*CCCC////////////// //CCCCCCC*CCC////////////// /CCCCCCCCC*CCC///// / //CCCCCCCCCC*CC///// // /// //CCCCCCCCCCC*C///////// ////// /////CCCCCCCCCC*C// // // ////// //////CCCCCCCC//*/ // / ////// CC//////CCCCCCC//* ///////// CCC////////////// * ///////// /C//////////// *1.3N,31.4W //// /////// */ *// / /*/// // /*/// / /*// /*// * // * /// * // // * //// * ///// * ////// * ///// /// * /// Pos Rpt / // * / 0133 // X 1.4S,32.8W // Valid for // / 0130-0200z // Pilot feedback at url: http://[site deleted] 30-39Kft >40Kft /=30-39Kft C=>40Kft Graphical view (EFB concept) Text-based view for ACARS printer
Oceanic Diagnosis and Nowcasting System CTop CClass GCD Convective Nowcasting Oceanic (CNO-Titan) makes 1-hr and 2-hr nowcasts of storm location using an object tracker (Titan) CNO- Titan Nowcast CNO- Gridded Nowcast CNO-Gridded produces gridded nowcasts that will more closely resemble storm structures CNO-RF utilizes environmental and model-based inputs to better predict storm initiation and decay [Cai et al. (2009)] CNO-RF Random Forest Nowcast Convective Diagnosis Oceanic (CDO) identifies convective cells With Growth/Decay CDO Interest Without Growth/Decay CDO Binary Product With Growth/Decay
CNO Based on TITAN (Dixon and Wiener, 1993) An Example of 1 Hr CNO-TITAN TITAN for Radar Data *1 hr nowcast of CDO valid at 1315 UTC on August 19, 2007 using TITAN technique is shown on the right; red lines on the right represent CDO = 2.5 verification. *Advantages of TITAN: computationally efficient; capability of addressing growth/decay. *Disadvantages of TITAN: polygons can only roughly represent storm shapes; tends to over-forecasting
TITAN Motion Vectors at t0 Gridded 0 hr TITAN Motion Vectors Gridded 2 hr TITAN Motion Vectors Gridded 1 hr TITAN Motion Vectors Merged with GFS Winds Closest in Time Merged with GFS Winds Closest in Time Merged with GFS Winds Closest in Time Temporal & Spatial Smoothing Temporal & Spatial Smoothing Temporal & Spatial Smoothing 15-60 min Motion Vectors 75-120 min Motion Vectors 135-180 min Motion Vectors 15-60 min Forecasts by Advecting Original Satellite Data at t0 75-120 min Forecasts by Advecting 60 min Nowcasts 135-180 min Forecasts by Advecting 120 min Nowcasts CNO Based on Modified TITAN---- Gridded Forecast 1-3 Hr CNO-Gridded Forecast Flow Chart An Example of 1 Hr CNO-Gridded Forecast *Advantages of CNO-Gridded: realistic looking storms; low bias. *Disadvantages of CNO-Gridded: could be computationally expensive; no explicit growth/decay capability
CNO Based on Random Forest Statistical Analysis and Data Fusion • The random forest technique produces an ensemble of decision trees from labeled training instances • during training, RF generates estimates of predictor importance • RF trees “vote” on classification of new data points, comprising a nonlinear empirical model that provides both deterministic predictions and probabilistic information Data pt. Data pt. Data pt. Data pt. Data pt. Tree 2 Tree 3 Tree 100 Tree 1 Tree 4 … Vote: 0 Vote: 0 Vote: 0 Vote: 1 Vote: 1 => 40 votes for “0”, 60 votes for “1”; consensus category “1” *Slide courtesy of John Williams and Dave Ahijevych
CNO-RF An Example of CNO-RF Forecast Compared with CNO-TITAN ( 1 hr) B Hurricane Dean A C *1 hr forecasts valid at 1315 UTC on August 19, 2007 for both techniques; Red lines represent CDO = 2.5 verification *Advantages of random forest technique: more realistic looking storms; taking into account of storm environment to address storm growth/decay. *As a relatively new, novel technique for nowcasting, its potential needs to be fully explored D CNO-TITAN B CNO Hurricane Dean A C D
Statistical Evaluation of the Three Nowcasting Techniques CSI BIAS • 5 days of data from Aug 19-23, 2007 over the Gulf of Mexico domain are used to calculate the statistics with a grid size of ~ 5 km and CDO threshold of 2.5 • All three techniques show skill over persistence • RF and gridded forecast perform best at 1 hr lead time • TITAN is the best at 2-3 hr lead time • Gridded forecast is the best for 4-6 hr lead time
Relative Skill Comparisons of Three Nowcasting Techniques versus Persistence • Gridded and RF nowcasts ~10 % better than persistence at 1 hr lead time • TITAN is the best for 2 and 3 hr lead time (~20-30% improvement) • Gridded nowcasts the best for 4,5 and 6 hr lead time (~ 15-25% improvement) • Overall, gridded technique seems to be the best performer
Examples of 1 hr Gridded Forecast over the Gulf of Mexico Domain 1 HR D Issue time: 1215 UTC 2009/09/05 Valid time: 1315 UTC 2009/09/05 C B A *White lines are CDO=2.5 verification, satellite data available every 30 min
Examples of 3 hr Gridded Forecast over the Gulf of Mexico Domain 3 HR Issue time: 1215 UTC 2009/09/05 Valid time: 1515 UTC 2009/09/05 D C B A *White lines are CDO=2.5 verification, satellite data available every 30 min
Examples of 6 hr Gridded Forecast over the Gulf of Mexico Domain 6 HR Issue time: 1215 UTC 2009/09/05 Valid time: 1815 UTC 2009/09/05 D C B A *White lines are CDO=2.5 verification, satellite data available every 30 min
Examples of 3 hr CDO Forecasts Based on CNO-Gridded Technique in the West Pacific Domain 3 HR Issue time: 2100 UTC 2009/12/28 Valid time: 0000 UTC 2009/12/29 A D C B *White lines are CDO=1.5 verification; Cloud class is not used in CDO *Satellite data are available every 3 hrs
Examples of 3 hr CDO Forecasts Based on CNO-Gridded Technique in the West Pacific Domain 3 HR Issue time: 0000 UTC 2009/12/29 Valid time: 0300 UTC 2009/12/29 A D C B *White lines are CDO=1.5 verification; Cloud class is not used in CDO *Satellite data are available every 3 hrs
Examples of 3 hr CDO Forecasts Based on CNO-Gridded Technique in the West Pacific Domain 3 HR Issue time: 0300 UTC 2009/12/29 Valid time: 0600 UTC 2009/12/29 A D C B *White lines are CDO=1.5 verification; Cloud class is not used in CDO *Satellite data are available every 3 hrs
Summary Statistics of CNO-Gridded Forecasts The black squares are statistics from Aug 19-22, 2007 What are the GFS model scores for oceanic convection??? • 30 days of data from Sep 1-30, 2009 over the Gulf of Mexico domain are used to calculate the statistics with a grid size of ~ 5 km and CDO threshold of 2.5 • The results showed here could serve as benchmark performance of extrapolation-based nowcasting techniques for oceanic convection • Similar verification for model forecasts need to be done so that a comparison of convective forecasting skills between model and extrapolation can be obtained
Summary and Future Work • The challenges of nowcasting convection over the ocean at the current stage are caused by the lack of 1) high spatial and temporal resolution data; 2) the best way to identify convection over the ocean; and 3) the best way to blend observation-based extrapolating nowcasts with model-based convective forecasts. • The nowcasting products need to be uplinked to transoceanic aircraft for situational awareness. • Three nowcasting techniques (CNO-TITAN, CNO-Gridded and CNO-Random Forest) for oceanic convection forecasting in the 1-6 hr time frame are implemented, tested and compared in the Gulf of Mexico domain • Based on the overall performance statistics, CNO-Gridded forecasts for 1-8 hr are implemented in the Gulf of Mexico and Pacific domain in the realtime Oceanic Diagnosis and Nowcasting System. • The summary statistical performance of CNO-Gridded extrapolating technique could serve as benchmark for future blending work of GFS model and extrapolating for oceanic convection in 1-8 hr time frame.