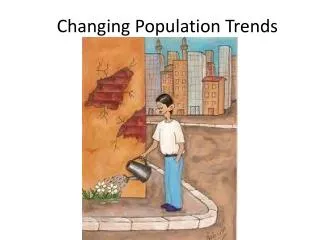

Changing Population Structure
E N D
Presentation Transcript
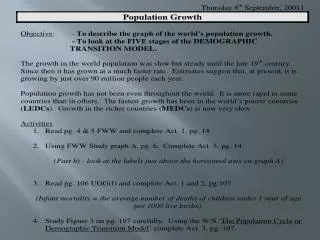
Learning Objectives • Recap understanding of the DTM and its relationship to population pyramids of different shapes. • Be able to describe and explain spatial differences in population structure • Understand the consequences of changing population structures – ageing population in the MEDW and youthful population in LEDW
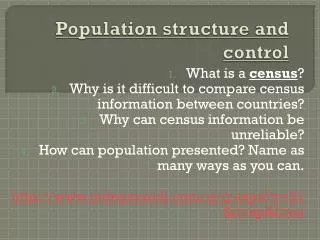
Why could population vary spatially? • Different living standards / level of development between regions • Different religious, racial or national groups. • Availability of jobs / types of jobs • Uneven effects of migration. • Effects of AIDS in some countries • Decisions about availability of family planning
UK spatial variations • Retirement towns e.g. Bournemouth will have a regressive and top-heavy structure because of the in-migration of elderly people
UK spatial variations • New towns e.g. Milton Keynes or Stevenage will have an expanding population – a ‘bulge’ of younger, economically active people (BR will be above average)
UK spatial variations • University towns e.g. Oxford or Cambridge will have higher proportions of young adults • Remote rural areas e.g. central Wales will show the effects of the out-migration of young adults
Spatial variations in the LEDW • Tanzania – Dar es Salem
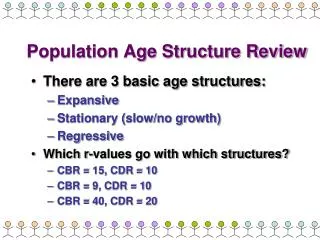
Youthful populations in the LEDW • This is known as a progressive population structure – typical of low income LEDCs e.g. Uganda
Ageing populations in the MEDW • The regressive population structure
Outline the social, economic, demographic and political implications of an ageing population in the UK. • Growing Grey article • Bowen and Pallister P180-181 • http://www.geographyinthenews.rgs.org/news/article/default.aspx?id=298 • http://news.bbc.co.uk/1/hi/in_depth/uk/2004/ageing/default.stm • Photocopied sheets