Aug. 16
ºC. 40. Temperature. 35. The highest temperature. 30. The lowest temperature. 25. Mean temperature in one day. 20. 15. Date in 2008. Supplemental Fig. S 1 Greenhouse temperature during the experiment. The highest, lowest, and mean temperatures for each day are indicated. Aug. 24.

Aug. 16
E N D
Presentation Transcript
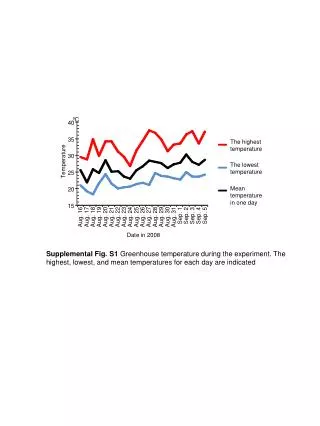
ºC 40 Temperature 35 The highest temperature 30 The lowest temperature 25 Mean temperature in one day 20 15 Date in 2008 Supplemental Fig. S1 Greenhouse temperature during the experiment. The highest, lowest, and mean temperatures for each day are indicated Aug. 24 Aug. 16 Aug. 18 Aug. 19 Aug. 20 Aug. 21 Aug. 22 Aug. 23 Aug. 25 Aug. 26 Aug. 27 Aug. 28 Aug. 29 Aug. 30 Aug. 31 Aug. 17 Sep. 4 Sep. 1 Sep. 2 Sep. 3 Sep. 5
L2 L15 L19 L22 0 0 2 0.3 Supplemental Fig. S2 Appearance of F3 lines. Each F3 line contains of 12 plants (two rows of six plants) grown in the inoculated soil medium. Line identifiers (above) and mean DIs for each line (below) are indicated
KBrS003O10N1 Anju GC 400bp 300bp Genotype A 2 B 0 B 0 H 1 A 2 H 1 A 2 H 0 H 0 H 0 H 1 H 0 A 2 A 2 B 0 H 0 Phenotype Supplemental Fig. S3 The electrophoresis pattern of PCR products generated from the KBrS003O10N1 marker. DNA samples were derived from ‘GC’, ‘Anju’, and F3 plants. Scored genotypes for the KBrS003O1N10 maker are indicated below each lane (A: ‘GC’, B: ‘Anju’, H: Heterozygous). Inoculation test phenotypes (DI scores) are also provided below each band. Arrows indicate parental plants.
B. oleracea (O7) A. thaliana (At3 & At4) B. rapa (R3) KBrH005A08 pW166 100 kb At4g24330 TCR05 KBrS003O10 At4g22930 BSA8 1 cM KBrB084F01 2 cM At4g20150 Supplemental Fig. S4 Synteny map of the Foc-BoI region with A. thaliana and B. rapa. The chromosome numbers are given upon each vertical bars. The markers of B. oleracea that are homologous with A. thaliana genes or B. rapa BAC clones are connected by broken lines. KBrS003O10N1 that is closest to Foc-Bo1 is given in bold. KBrB089H07N1 that is closest to pbBo(Anju)4 is underlined Foc-Bo1 KBrS012D09 KBrS003O10N1 KBrB089H07 KBrB089H07N1 At4g16070 KBrB084F01N1 At4g15232 KBrS012D09N At3g51910 At3g51410