1 / 1

Supplementary Figure 1- FUJIMURA et al.

A. Hyp-eIF5A1. Poorly Differentiated. Well Differentiated. 4. Normal. eIF5A1. 4. 3. eIF5A2. 3. C. IHC score. *. *. 2. Poorly Differentiated. Well Differentiated. IHC score. 2. GAPDH. Normal. 1. eIF5A1. eIF5A2. 1. control. 0. normal. Grade II. Grade I. 0.

eric-barber
Download Presentation

Supplementary Figure 1- FUJIMURA et al.

An Image/Link below is provided (as is) to download presentation Download Policy: Content on the Website is provided to you AS IS for your information and personal use and may not be sold / licensed / shared on other websites without getting consent from its author. Content is provided to you AS IS for your information and personal use only. Download presentation by click this link. While downloading, if for some reason you are not able to download a presentation, the publisher may have deleted the file from their server. During download, if you can't get a presentation, the file might be deleted by the publisher.

E N D

Presentation Transcript


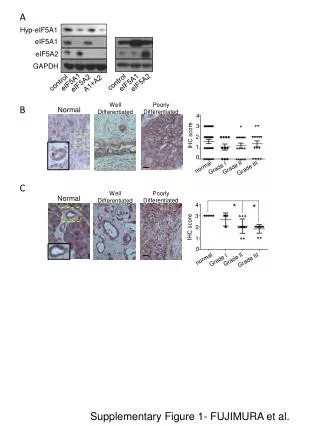
  1. A Hyp-eIF5A1 Poorly Differentiated Well Differentiated 4 Normal eIF5A1 4 3 eIF5A2 3 C IHC score * * 2 Poorly Differentiated Well Differentiated IHC score 2 GAPDH Normal 1 eIF5A1 eIF5A2 1 control 0 normal Grade II Grade I 0 Grade III normal Grade II Grade I Grade III B control eIF5A1 A1+A2 eIF5A2 Supplementary Figure 1- FUJIMURA et al.

More Related