Download
1 / 37
390 likes | 697 Views
Lecture 2a: Igneous classification, mid-ocean ridges. Questions How many igneous rock names should you learn, and what do they mean? What is a mid-ocean ridge and how does it work? How does plate spreading produce the oceanic crust?

E N D
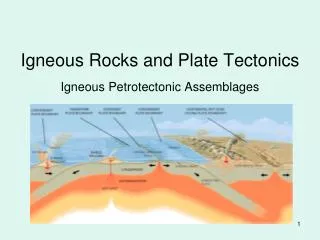
Lecture 2a: Igneous classification, mid-ocean ridges • Questions • How many igneous rock names should you learn, and what do they mean? • What is a mid-ocean ridge and how does it work? • How does plate spreading produce the oceanic crust? • How do rocks observed at ridges constrain the state of the upper mantle? • Tools • Field and shipboard geology and analytical chemistry • Thermodynamics • Fluid dynamics • Reading: Grotzinger et al., chapter 4; Albarède, chapter 8 1
Igneous Classification • Igneous rocks can be classified according to composition, mineralogy, texture and/or locality(!). • The first distinction is between volcanic and plutonic rocks. • Volcanic rocks are erupted at the Earth’s surface and cool very quickly. There is insufficient time to grow large crystals. This leads to formation of glass or very fine-grained rocks, or to phenocrysts (crystals that grew before eruption) in a fine groundmass. • Plutonic rocks crystallize at some depth, and therefore lose heat relatively slowly. Crystals have time to grow after nucleation, and the resulting rocks generally have individual crystals large enough to see unaided. • Rocks of exactly the same composition and mineralogy get different names in their volcanic and plutonic forms, because they look different! 2
Classification by mineralogy • The standard classification scheme uses the mineralogy of the rock (how much quartz, how much plagioclase, etc.) • There is one important twist…for volcanic rocks you usually cannot measure the actual minerals present (or it may be a glass and there are no minerals present). • In this case, instead of the actual minerals, you classify based on normative mineralogy • The norm is a calculation based on the bulk composition of a volcanic rock, for what minerals would be present if it were fully crystallized. • The standard norm calculation is called the CIPW norm, after Cross, Iddings, Pirsson, and Washington (1902). 4
Classification by mineralogy Mineral content (actual or normative) of the rock by volume is divided into Quartz (Q), Alkali feldspar (A), Plagioclase (P), Feldspathoids (F), and Mafic minerals like amphibole, biotite, pyroxenes, and olivine (M). For rocks with M < 90%, the Streckeisen double-triangle is used. It shows names defined by Q-A-P-F recalculated to 100%. Many of these names are really obscure; don’t try to learn all of them. 5
Classification by mineralogy For rocks with mostly mafic minerals, a different scheme is used. The proportion of olivine, orthopyroxene, clinopyroxene, and plagioclase locate a rock using the appropriate Streckeisen ternary diagram. 6
Classification by composition • There are several classifications, of individual rocks or rock suites. • By silica percentage: %SiO2 Designation % Dark Minerals Designation Example rocks >66 Acid <40 Felsic Granite, rhyolite 52-66 Intermediate 40-70 Intermediate Diorite, andesite 45-52 Basic 70-90 Mafic Gabbro, basalt <45 Ultrabasic >90 Ultramafic Dunite, komatiite • By alumina saturation (this controls which dark minerals show up): Chemistry Designation Distinctive Minerals Al2O3>Na2O+K2O+CaO Peraluminous Muscovite, biotite, topaz, corundum, garnet, tourmaline Na2O+K2O+CaO>Al2O3 MetaluminousMelilite, biotite, pyroxene & Al2O3 > Na2O+K2O hornblende, epidote Al2O3 ~ Na2O+K2O Subaluminous Olivine, pyroxenes Al2O3 < Na2O + K2O Peralkaline Sodic pyroxenes & amphiboles 7
Classification by composition • By Alkali-Lime index: for a suite of rocks, CaO and Na2O+K2O are plotted against SiO2. Generally, CaO decreases with increasing SiO2 while Na2O+K2O increases. Suites are classified by the SiO2 where the intersection occurs: Rock Suite Alkali-Lime Index Illustrative rock series Calcic >61 %SiO2 Mid-ocean ridge basalts Calc-alkaline 56-61% Continental margin arc series Alkali-calcic 51-56% Some intraoceanic island arcs Alkaline <51% Intraplate continental melts 8
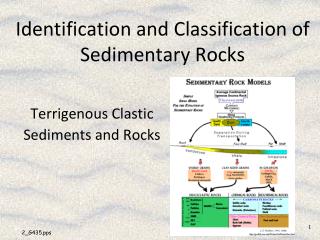
Ocean crust geology • Recall the typical sequence of rocks observed in ophiolite exposures and in drilling the ocean crust: • Deep-sea marine sediments • Massive sulfide deposits • Pillow basalts • Sheeted basaltic dikes • Layered gabbro • Serpentinized peridotites • This sequence is consistent with the seismic velocity profile of oceanic crust: 9
Ocean Crust Geology Modern and ancient pillow basalts, photographed by submersible and by field geologist, respectively. 10
Ocean Crust Geology Modern and ancient sheeted dike complexes observed by seismology and by field geologist, respectively. 11
Ocean Crust Geology Modern and ancient layered gabbro (oceanic layer 3) complexes observed by ocean drilling and by field geologist, respectively. 12
Ocean Crust Geology Modern and ancient harzburgite/dunite uppermost mantle assemblages: An abyssal peridotite and the Muscat massif in Oman 13
Mid-ocean Ridges Now let’s discuss the origin of this rock sequence in the detailed mechanisms and variations that occur along ridges. • Fluid dynamics: plate-driven flow, internal buoyancy • A ridge is a viscous fluid asthenosphere overlain by an initially very thin rigid lithosphere that is being pulled laterally apart along a linear rift by externally-imposed forces. Approximately two-dimensional flow. • Flow is slow enough to neglect inertia (tiny Reynolds number); hence the 2-D stream function y (a scalar function whose contours are parallel to the flow and whose spacing is proportional to velocity) for incompressible flow satisfies the biharmonic equation: 14
Mid-ocean ridge dynamics • For uniform viscosity, the steady solution to this corner flow is given by Batchelor (1967) 15
Mid-ocean ridge dynamics • Things to note about this flow field: • It fills all of half-space, out to infinite depth and infinite lateral extent. • The pressure goes to –∞ at the corner! • Flow under the ridge axis is near vertical, flow far out to the side is nearly horizontal, but there is a positive upward vertical component everywhere. • There are real complexities superposed on this simple solution that should be noted right away: • The lithosphere thickens away from the ridge axis with the square root of time, so the upper boundary of the asthenospheric flow is not horizontal. Streamlines get gradually incorporated into the lithosphere and the depth of material points becomes fixed. 16
Mid-ocean ridge dynamics: More complexities • The viscosity is NOT constant. Viscosity variations are due to: • Temperature – to first order this is the difference between lithosphere and asthenosphere, but it is not really a sharp cutoff. • Strain Rate – the viscosity may be strain or stress-dependent, so that areas flowing fast are weaker and tend to concentrate strain ever more. • Melting – the presence of melt above the solidus may weaken the partially molten region • Water – ~100 ppm H2O in mantle olivine lowers viscosity by a factor of ~500. This H2O is removed to the melt phase when melting begins, so melting may increase the viscosity! • The viscosity of mantle flow in and near the melting region is somewhere in the range 1018 to 1023 Pa-s 17
Mid-ocean ridge dynamics: More complexities • Drag from upper boundary condition is not the only driving force for flow. There is also internal buoyancy. due to: • Presence of retained melt in the melting region. Liquids are less dense than mantle minerals at these pressures. The more melt is retained, the more buoyant the rock. • Change in composition of the residue with progressive melt extraction. Melting removes Fe and garnet-forming components, so solid residue becomes less dense even as low density melt is being extracted! • [This is not non-physical; there is no law of conservation of volume] • The flow is not incompressible – both melt production and melt extraction cause changes in the volume of the “fluid” (really a multiphase medium). 18
Mid-ocean ridge dynamics: More complexities Here is a model incorporating these complexities, showing cases dominated by plate spreading and by internal buoyancy. The R parameter depends on spreading rate, viscosity, and buoyancy of retained melt. Color is melt-filled porosity, white streamlines are solid flow, black streamlines are melt flow. 19
Melting and melt extraction • When mantle is dragged upwards towards the ridge by plate spreading, it is initially solid. Why does it melt? How does it melt? • (see my chapter from the Encyclopedia of Volcanoes) • The upwelling path is (to very good approximation) adiabatic and reversible and therefore isentropic. The drop in temperature per unit pressure at constant entropy in the absence of phase changes is • For upper mantle this slope is ~10 K/GPa. • The solidus of fertile peridotite has a slope of ~130 K/GPa • It follows that unless the mantle is really cold (and it is not), the adiabat will intersect the solidus upon decompression 20
Melting and melt extraction • The intersection of adiabat and solidus depends on the potential temperature of the mantle (the temperature where the adiabat would reach 1 atmosphere if no melting took place). • For ordinary regions, this is close to 1350°C (~1250 to ~1500 global range) and the solidus is crossed at about 2.5 GPa (~1.5 GPa to ~6 GPa global range). 21
Melting and melt extraction • Once melting begins on an upwelling streamline, it will continue until either • upwelling ceases • conduction to the surface cools the system • internal thermochemistry of the residue slows or stops melting • The cartoon version of the melting regime under the ridge axis is then drawn on the cartoon version of the flow field as some generally triangular shape in cross-section: 22
The mid-ocean ridge Melting Regime • The bottom of the melting regime is horizontal if the potential temperature is locally uniform • The upper edges of the triangle either represent where the flow lines become effectively horizontal or where cooling from the surface has penetrated to the relevant depth • The extent of melting increases upwards along each streamline from the solidus intersection to the exit of the melting regime (indicated by shading in the figure) 23
The mid-ocean ridge Melting Regime • The erupted melt is going to be some average of the melts produced throughout this melting regime • Several models are possible of how and where the melt is extracted and what happens to it during transport • This average melt is primary mid-ocean ridge basalt (MORB). The melting regime is wide (hundreds of kilometers), but eruptions are focused in a neovolcanic zone only a few km wide – melts have to be focused somehow to the ridge axis. This figure is the result of a large project to seismically image the melting regime on the East Pacific Rise. 24
Melt productivity After melting begins, the P-T path and the amount of melt production can be inferred from conservation of entropy. At constant total entropy, the only way for the system to find the entropy of fusion is by cooling more steeply than the slope of the solid adiabat. 25
Melt Migration • There are multiple mechanisms to get the partial melt out of the residue and deliver it to the crust at the ridge axis. • Porous flow • The melt phase quickly forms an interconnected network along the grain boundaries of the rock (mantle source rocks are made of crystals about 1mm-1cm in diameter). • Interconnection occurs because the energy of a melt-crystal interface is low enough that the melt adopts a high-surface area geometry. • This geometry implies that the partially molten rock is permeable to flow of the melt relative to the solid. • Permeable flow is governed by D’Arcy’s Law • where P is pressure, k is permeability, f is porosity or melt fraction, m is melt viscosity, and v is the velocity of melt relative to solid. 26
Melt Migration • Pressure gradients driving porous flow of the melt arise from buoyancy of the melt (density of mantle ~ 3300 kg m-3, density of basaltic liquids ~2700 kg m-3) and from shear and bulk deformation of the solid matrix. • Permeability is an increasing function of melt-filled porosity and grain size. • Exact function is unknown, but it may be k ~ d2f2 or d2f3. • For 1 mm grains and a melt-filled porosity of 1%, the permeability is ~10–11 cm2. • For basaltic melt with viscosity ~ 10 Pa s, v ~10 mm/yr, not much faster than solid flow rates! • We know melt somehow eventually moves much faster than this, so there must be other melt flow mechanisms. 27
Melt Migration • How do we know that the melt-filled porosity resulting from melting and melt migration is ~1%? • Cannot guess from balancing melting rate and migration rate, since permeability function is poorly known • But we have seismology, which does not show the extraordinarily low velocities that would be expected for large melt fractions. And we have chemistry of residues (There is a homework question on this…) 28
Melt Migration • During porous flow at low melt fractions, melt and solid remain in chemical equilibrium. But primary MORB is not in equilibrium with uppermost oceanic mantle. So again, something else must happen. • Fast porous flow • Porosity waves: The equations for porous flow in a viscous two-phase system allow solutions in the form of solitary waves that may propagate much faster than the D’Arcy velocity and speed up melt transport (contours of porosity; gridded area is <1%; this figure shows the collision of two magma solitons moving upwards in a deformable porous medium) 29
Melt Migration • High-porosity zones, reactive transport channels: focusing the melt flow This may arise due to reactive infiltration instability: porous flow of liquid breaks up into channels if it can dissolve the pyroxenes, leaving high melt fraction and olivine residue. The evidence for this process in nature is veins of dunite (pure olivine) in ophiolites: if melt flows through the dunite channels, this may explain the observation that MORB is not in equilibrium with abyssal peridotite (when you find dunites, these are in equilibrium with MORB). 30
Formation of the crust, magma chambers, differentiation • End result of mantle melting and melt migration is delivery of primary magma into the crust. • Too dense to erupt, forms magma chambers instead. • Cools by conduction and hydrothermal convection and begins to crystallize, with two essential consequences: • the formation of a gabbroic lower crust from the crystallized fraction • the compositional evolution of the remaining melt before eruption. Pprimary MORB crystallizes olivine, then olivine+plagioclase, then olivine+ plagioclase+clinopyroxene. These are the minerals of the oceanic lower crust and also the phenocryst phases in erupted MORB. 31
Troctolite: 24% Al2O3 13% MgO Olivine+plagioclase fractionation Gabbro: 17% Al2O3 11% MgO Olivine+plagioclase+clinopyroxene fractionation Olivine fractionation Primary Liquid Dunite: 0% Al2O3 50% MgO +titanomagnetite or ilmenite Evolution of oceanic crust
Formation of the crust, magma chambers, differentiation • Where does the differentiation take place? • Phase equilibria indicate low pressure (0-2000 bars) • Seismic images show melt lens ~1 km below the axis of the East Pacific Rise • Crystallization takes places in the shallow melt lens or in mush zone in lower crust 33
Primary liquids? • If the primary liquid never erupts, what can we say about melting conditions in the mantle? How do we see back through the filter of differentiation? • One solution is to pick an arbitrary MgO content at which to compare data and models. MgO decreases throughout differentiation, so it is a good index to normalize against. Here is the correction of data to 8% MgO. Note that variation along the liquid line of descent is the first principal component of variability within basalt samples from a given location, but there remains local variability at 8% MgO, and when each region is averaged there are systematic differences between regions 34
Global systematics • The values of regionally-averaged Na8 (i.e., Na2O concentration corrected to 8% MgO), Fe8, water depth above the ridge axis, and crustal thickness show significant global correlations. • Where Na8 is high, Fe8 is low • Where Na8 is high, the ridges are deep • Where Na8 is high, the crust is thin 35
Global systematics • What is the interpretation of the global correlations in Na8, Fe8, axial depth, and crustal thickness? • Answer: Na8, an incompatible element, is an indicator of mean extent of melting. Fe8 is an indicator of mean pressure of melting. Axial depth is an indicator of mantle temperature, extent of melting, and crustal thickness combined. • So the global correlation implies that extent of melting and pressure of melting are positively correlated, on a global scale. 36
Synthesis of global systematics • The correlation of extent of melting with pressure of melting requires that the first-order control on variation among ridge segments is potential temperature. • If melting continues under the axis to the base of the crust everywhere, then high potential temperature means: long melting column high mean extent of melting low Na8 and high crustal thickness shallow axial depth; high mean pressure of melting high Fe8. Cold mantle yields the opposite. 37