Download
1 / 14
140 likes | 355 Views
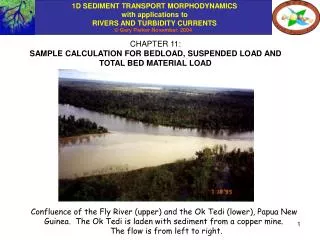
CHAPTER 11: SAMPLE CALCULATION FOR BEDLOAD, SUSPENDED LOAD AND TOTAL BED MATERIAL LOAD. Confluence of the Fly River (upper) and the Ok Tedi (lower), Papua New Guinea. The Ok Tedi is laden with sediment from a copper mine. The flow is from left to right. SAMPLE CALCULATION.

E N D
CHAPTER 11: SAMPLE CALCULATION FOR BEDLOAD, SUSPENDED LOAD AND TOTAL BED MATERIAL LOAD Confluence of the Fly River (upper) and the Ok Tedi (lower), Papua New Guinea. The Ok Tedi is laden with sediment from a copper mine. The flow is from left to right.
SAMPLE CALCULATION The Fly River, Papua New Guinea has been subject to a heavy loading of sediment from the Ok Tedi copper mine. The waste sediment flows 140 km down the Ok Tedi (Ok means “River”) and enters the Fly River at D’Albertis Junction. Mining commenced in 1985. Data for the Fly River at the Kuambit Gaging Station, just downstream of D’Albertis Junction, has been collected since about 1980. Before the commencement of the mine, the total bed material load of the Fly River at Kuambit was estimated (rather crudely) to be in the neighborhood of 4.45 Mt/year (million metric tons per year). Here a full calculation is performed using actual data, pre-mine for the most part. Confluence of the Ok Tedi (lower) and Fly River (upper), Papua New Guinea. The lighter color of the Fly River is due to the disposal of sediment from a mine upstream. Kuambit Gaging Station is about 1 km downstream of the confluence.
SOME INFORMATION River slope S = 5.14 x 10⁻⁵ near Kuambit. Bankfull depth Hbf there is 9.45 m, as determined from the cross-section below. The river cross-section is plotted in undistorted form. It is only when the section is viewed in an undistorted plot that it becomes viscerally apparent how wide most natural alluvial streams are.
SOME INFORMATION contd. The relation between B and H was computed from the cross-section of the previous slide.
SOME INFORMATION contd. The pre-mine grain size distribution of the bed of the Fly River at Kuambit is given below; D50 = Dg = 0.211 mm, D90 = 0.425 mm and g = 1.63
SOME INFORMATION contd. The flow duration curve at Kuambit for 1994 is given below. The choice is because a) detailed pre-mine discharge measurements are lacking, and b) 1994 was a fairly typical year over the available record.
SUMMARY OF THE CALCULATION • The calculation is given in the spreadsheet RTe-bookDepDisTotLoadCalc.xls. The calculation uses a) the Wright-Parker (2004) relation for hydraulic resistance, b) the Ashida-Michiue (1972) relation for bedload transport and c) the Wright-Parker (2004) entrainment relation for the computation of suspended bed material transport. In the Wright-Parker (2004) method, corrections for flow stratification are not implemented for simplicity. The calculation, which uses a single grain size D ( = D50 here) and the normal flow approximation, proceeds as follows. • Assume a range of values of Hs, and use the Wright-Parker hydraulic resistance predictor to predict depth H, U, u* etc. for each value of Hs up to bankfull. • For each value of Hs, compute s* and thus the volume bedload transport rate per unit width qb from Ashida-Michiue. • Compute vs from D50, and then for each value of Hs find E from the Wright-Parker entrainment relation and the values of u*s/vs, S and Rep. • For each value of Hs compute the composite roughness kc from the results of the calculation of hydraulic resistance:
SUMMARY OF THE CALCULATION contd. • For each value of Hs compute the volume suspended bed material load per unit width qs from the relations • 6. Use the geometric relation B = B(H) to determine the width at every depth, and then compute the total volume bed load and suspended bed material loads Qb and Qs as Qb = qbB, Qs = qsB. • 7. For the kth value of Hs, i.e Hs,k, then, compute the values of Qb,k, Qs,k and Qt,k = Qb,k + Qs,k. • Determine from the flow duration curve the fraction of time pk for which the flow is in a range characterized by flow discharge Qk corresponding to Hs,k. • The mean annual loads Qbanav (bedload), Qsanav (suspended bed material load) and Qtanav (total bed material load) are then given as
RESULTS FROM CALCULATION OF BEDLOAD AND SUSPENDED BED MATERIAL LOAD
WHAT TO DO WHEN THE FLOW GOES OVERBANK? As the flow goes overbank, the channel depth still rises with increasing discharge, albeit much more slowly. This implies a sediment load that increases slowly as stage rises above bankfull. In the case of the Fly River near D’Albertis Junction, the floodplain is over 10 km wide, i.e. so wide that little increase in sediment load is likely realized. On the other hand, as flow goes overbank in a meandering river, the thread of high velocity can leave the channel and cut across the vegetated floodplain, causing the load to decrease as it loses its source from the river bed. In the case of the Fly, the wide floodplain should suppress this as well. So as a first approximation, in this case overbank load = bankfull load
SUMMARY OF RESULTS Bankfull discharge Qbf = 3018 m3/s Mean annual discharge Qm = 2355 m3/s Bankfull discharge is exceeded 29% of the time Note that a) the bankfull discharge is less than double the mean annual discharge, and b) the river is overbank for a significant amount of time. Such numbers are common for large, low-slope tropical streams. In most temperate streams, however, a) Qbf is much larger than Qm, and b) bankfull discharge is exceeded a few percent of the time at best. Mean annual bedload transport rate Qbavan = 0.34 Mt/a Mean annual suspended bed material load Qsavan = 2.14 Mt/a Mean annual total bed material load Qtavan = 2.48 Mt/a Percentage of annual bed material load that is bedload = 13.6%
REFERENCES FOR CHAPTER 11 Ashida, K. and M. Michiue, 1972, Study on hydraulic resistance and bedload transport rate in alluvial streams, Transactions, Japan Society of Civil Engineering, 206: 59-69 (in Japanese). Wright, S. and G. Parker, 2004, Flow resistance and suspended load in sand-bed rivers: simplified stratification model, Journal of Hydraulic Engineering, 130(8), 796-805.