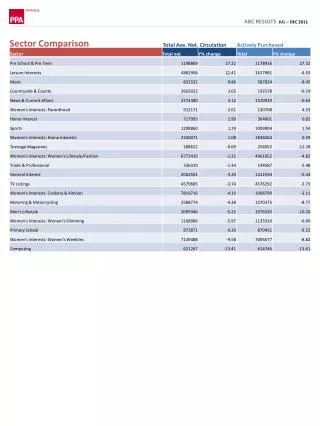
Comparative Analysis of Sector 9 Measurements Before and After Smoke Test
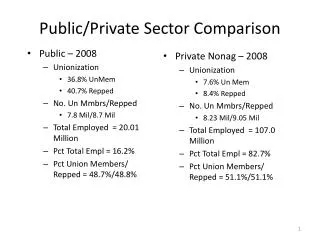
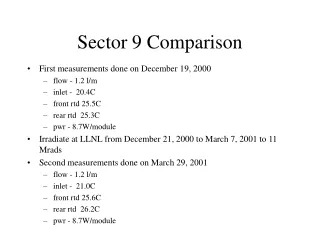
Analyzing power, temperature, and irradiation data of Sector 9 before and after a smoke test conducted on December 19, 2000, and March 29, 2001, respectively. Observations include flow rate, temperature differentials, power consumption, and irradiation levels. Power reductions and temperature changes noted during smoke test. Cooling effects post-smoke test observed.


Comparative Analysis of Sector 9 Measurements Before and After Smoke Test
E N D
Presentation Transcript
Sector 9 Comparison • First measurements done on December 19, 2000 • flow - 1.2 l/m • inlet - 20.4C • front rtd 25.5C • rear rtd 25.3C • pwr - 8.7W/module • Irradiate at LLNL from December 21, 2000 to March 7, 2001 to 11 Mrads • Second measurements done on March 29, 2001 • flow - 1.2 l/m • inlet - 21.0C • front rtd 25.6C • rear rtd 26.2C • pwr - 8.7W/module
Before After
Smoke Test • Power at 8.7W per module(at room T). • No cooling. • See T rise plot. • Note power drops by 20% at max T, R change. • Image at max T • Turn on cooling and reimage both sides
Before smoke test After smoke test