Sector 9 Comparison
50 likes | 67 Views
Sector 9 Comparison. First measurements done on December 19, 2000 flow - 1.2 l/m inlet - 20.4C front rtd 25.5C rear rtd 25.3C pwr - 8.7W/module Irradiate at LLNL from December 21, 2000 to March 7, 2001 to 11 Mrads Second measurements done on March 29, 2001 flow - 1.2 l/m

Sector 9 Comparison
E N D
Presentation Transcript
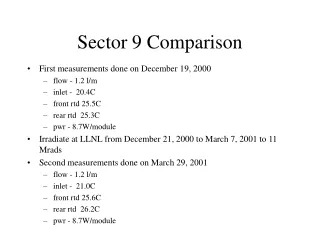
Sector 9 Comparison • First measurements done on December 19, 2000 • flow - 1.2 l/m • inlet - 20.4C • front rtd 25.5C • rear rtd 25.3C • pwr - 8.7W/module • Irradiate at LLNL from December 21, 2000 to March 7, 2001 to 11 Mrads • Second measurements done on March 29, 2001 • flow - 1.2 l/m • inlet - 21.0C • front rtd 25.6C • rear rtd 26.2C • pwr - 8.7W/module
Before After
Smoke Test • Power at 8.7W per module(at room T). • No cooling. • See T rise plot. • Note power drops by 20% at max T, R change. • Image at max T • Turn on cooling and reimage both sides
Before smoke test After smoke test