Download
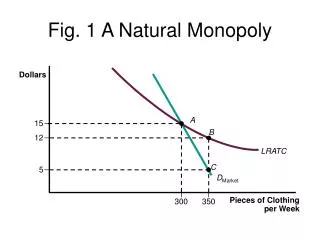
1 / 12
120 likes | 354 Views
Dollars. Pieces of Clothing per Week. Fig. 1 A Natural Monopoly. A. 15. B. 12. LRATC. C. 5. D Market. 300. 350. Monthly Price per Subscriber. Number of Subscribers. Fig. 2 Demand and Marginal Revenue. $60. A. 50. B. 48. C. 38. 30. F. 20. G. 18. Demand. 5,000. 15,000.

E N D
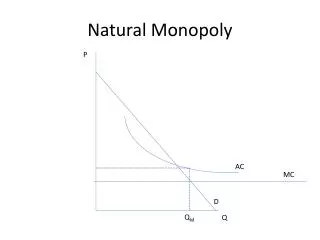
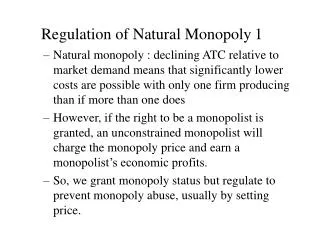
Dollars Pieces of Clothing per Week Fig. 1 A Natural Monopoly A 15 B 12 LRATC C 5 DMarket 300 350
Monthly Price per Subscriber Number of Subscribers Fig. 2 Demand and Marginal Revenue $60 A 50 B 48 C 38 30 F 20 G 18 Demand 5,000 15,000 20,000 30,000 6,000 21,000 MR
$60 Monthly Price per Subscriber 40 Number of Subscribers Fig. 3 Monopoly Price and Output Determination MC E D 10,000 30,000 MR
(a) (b) Dollars Dollars Number of Subscribers Number of Subscribers Fig. 4 Monopoly Profit and Loss ATC MC ATC MC AVC $50 E E $40 40 32 Total Loss Total Profit D D 10,000 10,000 MR MR
(a) Competitive Market (b) Competitive Firm Price per Unit Dollars per Unit 2. and each firm produces 1,000 units, where P = MC. 3. When monopoly takes over, the old market supply curve . . . Quantity of Output Quantity of Output 1. In this competitive market of 100 firms, equilibrium price is $10 Fig. 5a/b Comparing Monopoly and Perfect Competition S MC ATC E $10 $10 d D 1,000 100,000
4. becomes the monopoly's MC curve. 5. The monopoly produces where MR = MC, 6. with a higher price and lower market output than under perfect competition. Fig. 5c Comparing Monopoly and Perfect Competition (c) Monopoly Price per Unit S = MC F $15 E 10 MR D Quantity of Output 100,000 60,000
Dollars 1. Kafka services 250 homes per month, where MC and MR intersect . . . 2. and charges $70 per home. 3. ATC at 250 units is less than price, so profit per unit is positive. 4. Kafka's monthly profit–$10,000–is the area of the shaded rectangle. Homes Serviced per Month Fig. 6 A Monopolistically Competitive Firm in the Short Run MC A $70 ATC d1 30 MR1 250
In the long run, profit attracts entry, which shifts the firm's demand curve leftward. Dollars Entry continues until P = ATC at the best output level, and economic profit is zero. The typical firm produces where its new MR crosses MC. Homes Serviced per Month Fig. 7 A Monopolistically Competitive Firm in the Long Run MC ATC E $40 d1 MR1 MR2 d2 100 250
Gus’s Actions Confess Don’t Confess Gus’s profit = $25,000 Gus’s profit = –$10,000 Confess Filip’s Profit = $25,000 Filip’s Profit = $75,000 Filip’s Actions Gus’s profit = $75,000 Gus’s profit = $50,000 Don’t Confess Filip’s Profit = $–10,000 Filip’s Profit = $50,000 Fig. 8 A Duopoly Game
1.Before advertising, long-run economicprofit is zero. 2. In the short run, the first firms to advertise earn economic profit. Dollars 3. But in the long run,imitation and entry bring economic profit back to zero. 4. Advertising can lead to a higherprice in the long run, as in this panel . . . Bottles of Perfume per Month Fig. 9a Advertising in Monopolistic Competition B $120 C 100 ATCads ATCno ads A 60 dads dall advertise dno ads 1,000 6,000 2,000
5. or to a lower price in the long run, as in this panel. Dollars Bottles of Perfume per Month Fig. 9b Advertising in Monopolistic Competition dall advertise B $120 A 60 C ATCads 50 ATCno ads dads dno ads 1,000 6,000 2,000
American's Actions Run Safety Ads Don't Run Ads American earns low profit American earns very low profit Run Safety Ads United earns low profit United earns high profit United's Actions American earns high profit American earns medium profit United earns medium profit Don't Run Ads United earns very low profit Fig. 10 An Advertising Game